Collection
Data Visualization
Below are a handful of data visualization design highlights from the last decade of my career from both freelance, in-house and agency time.
Designing with data has been a part of my work since the very beginning of my career–shout out Doug Scott at Northeastern for sparking a love of visualizing complex information and turning it into a story.
Personal
2015–2016Visualizing the Past
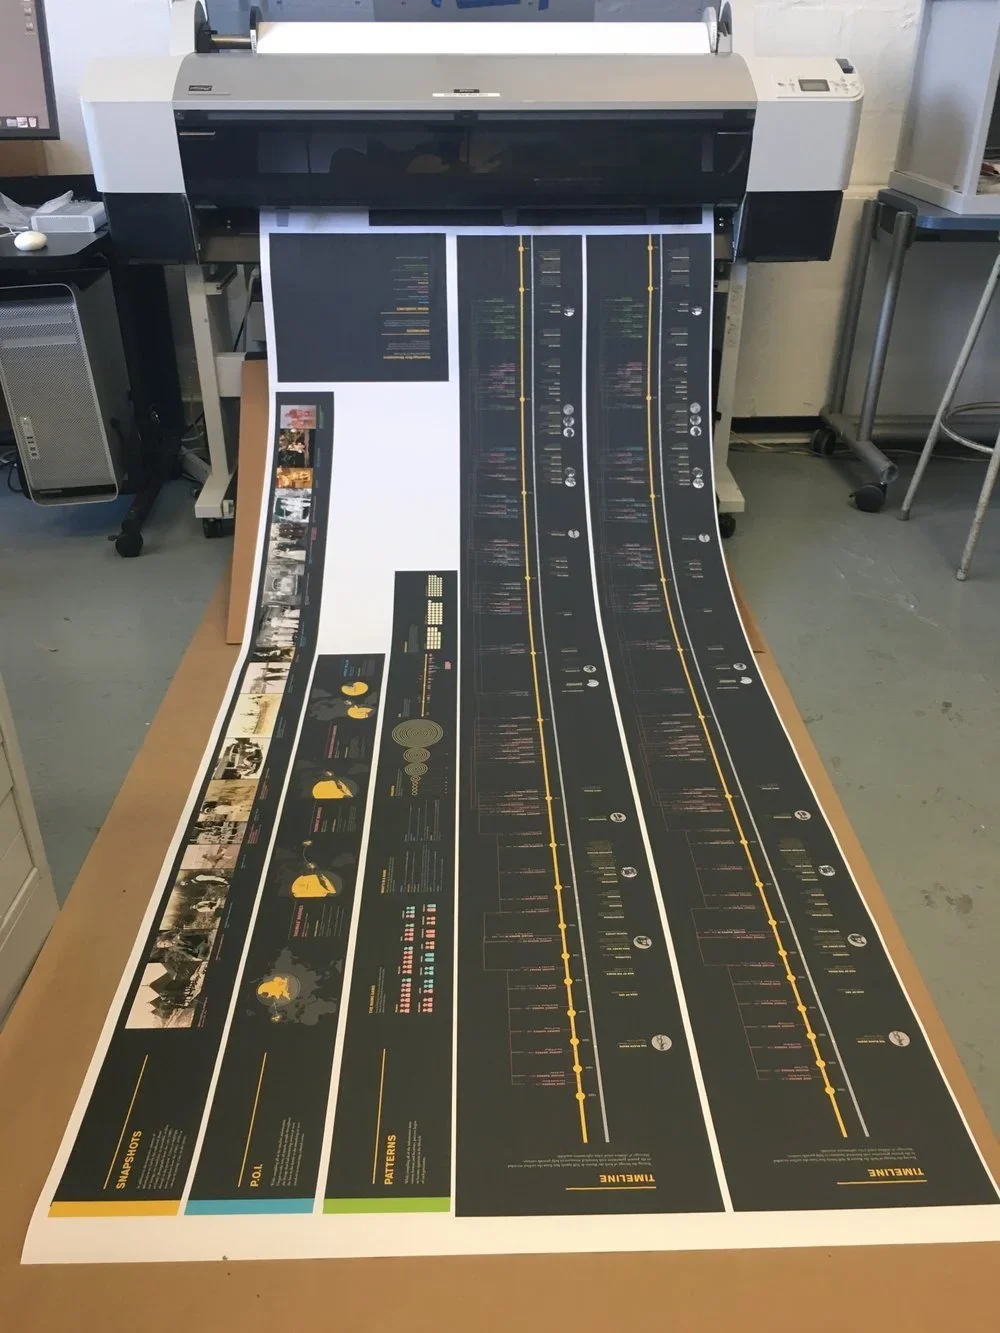
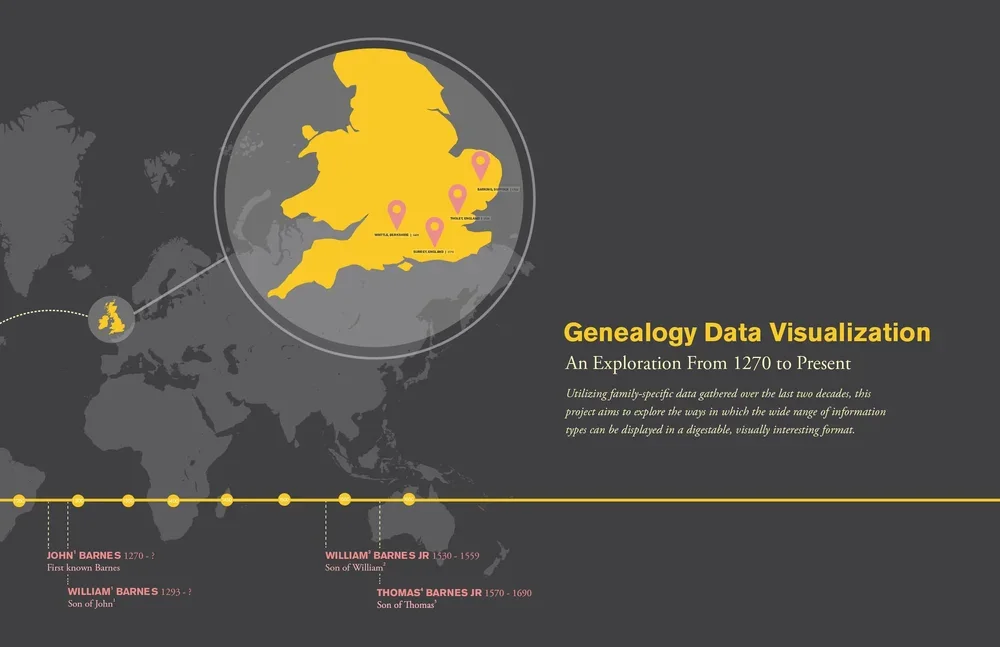
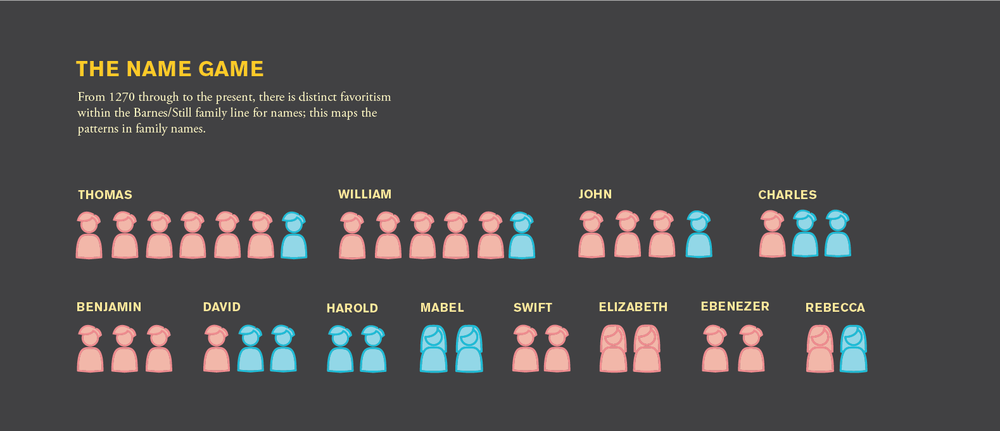
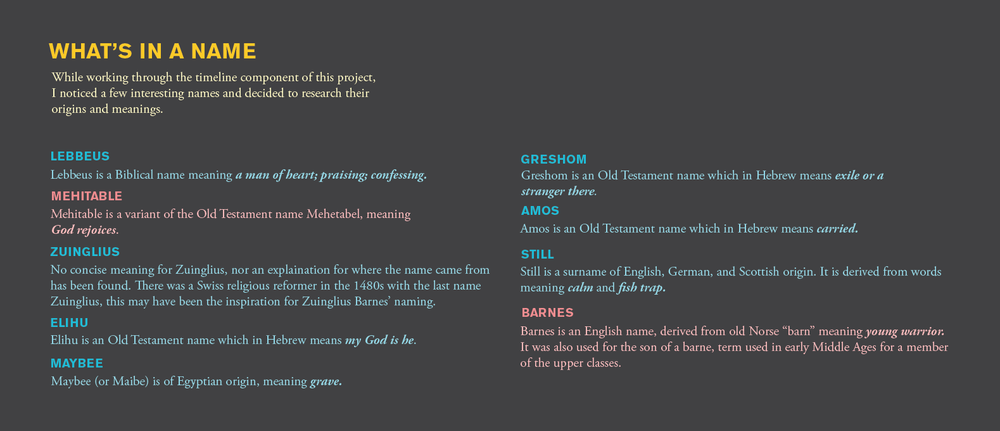
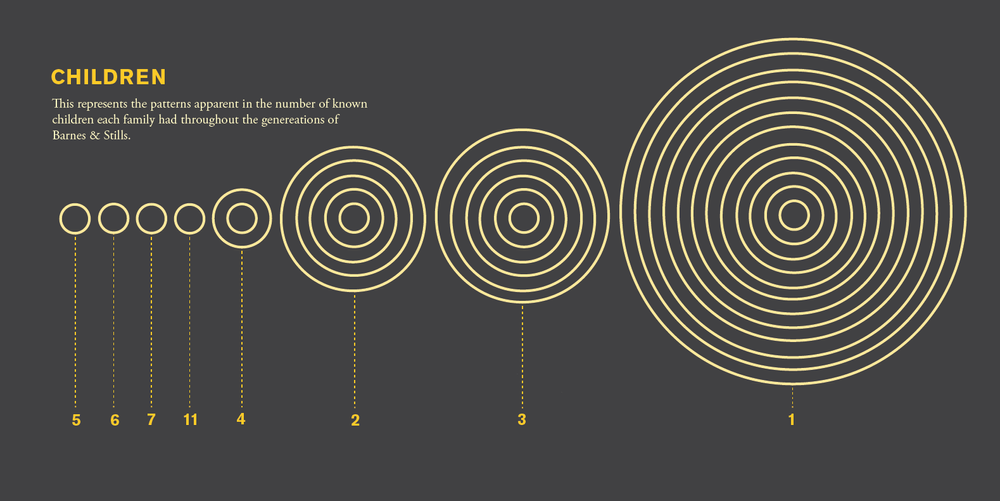
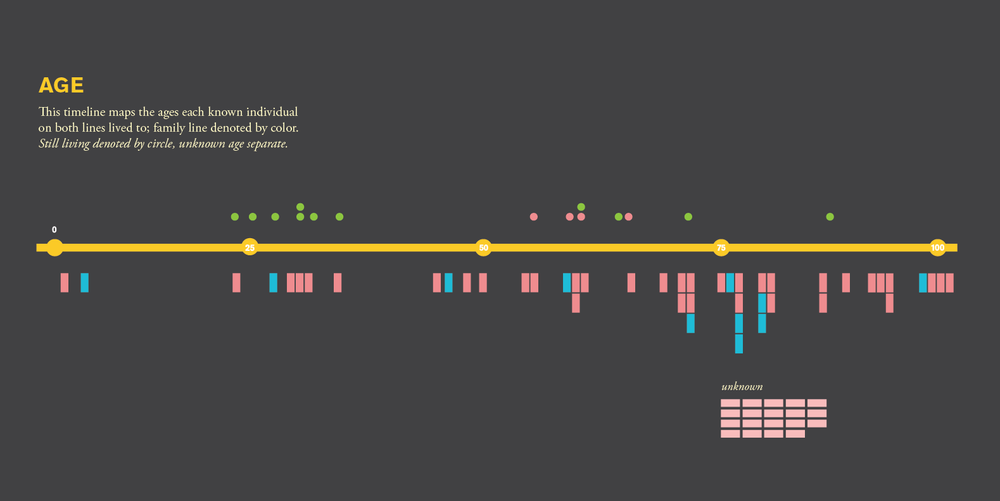
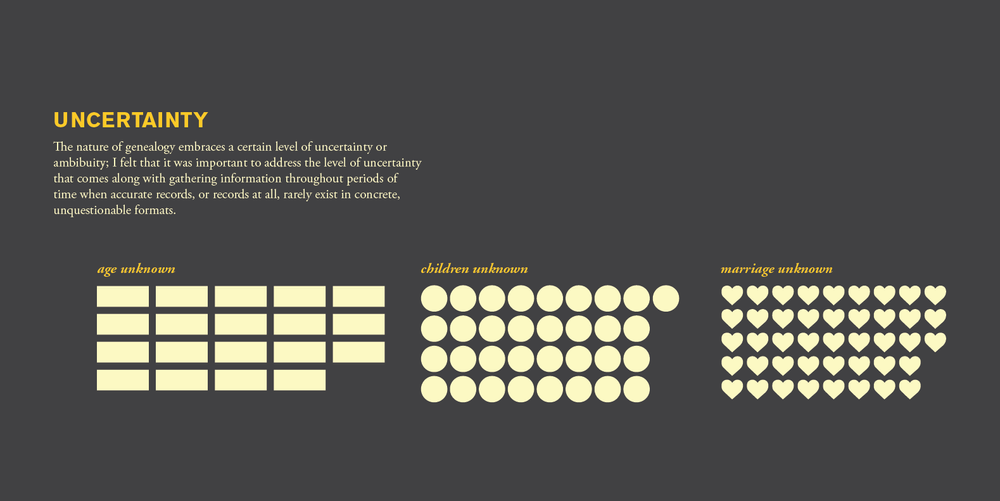
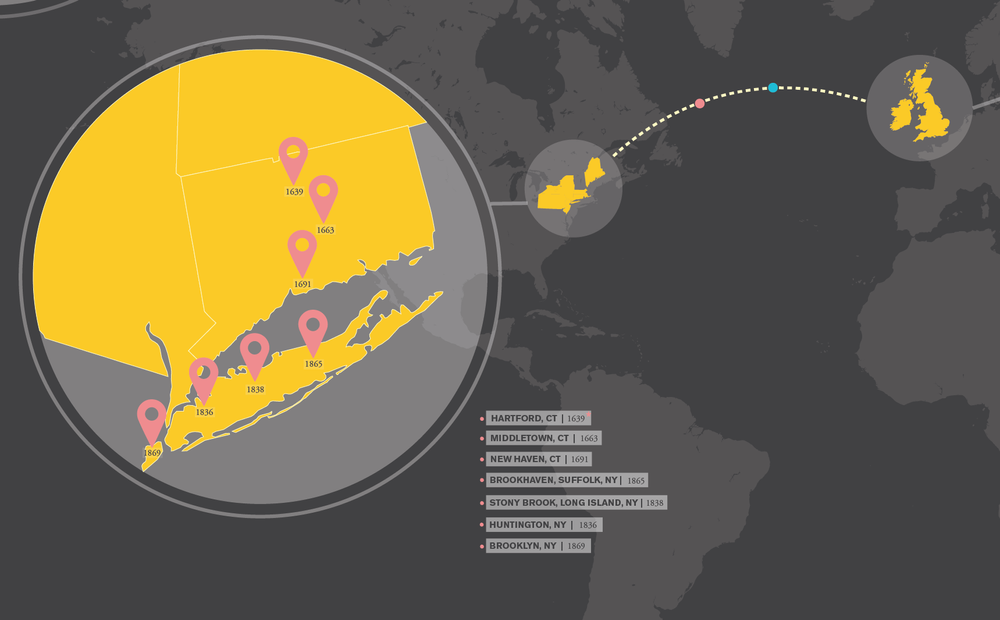
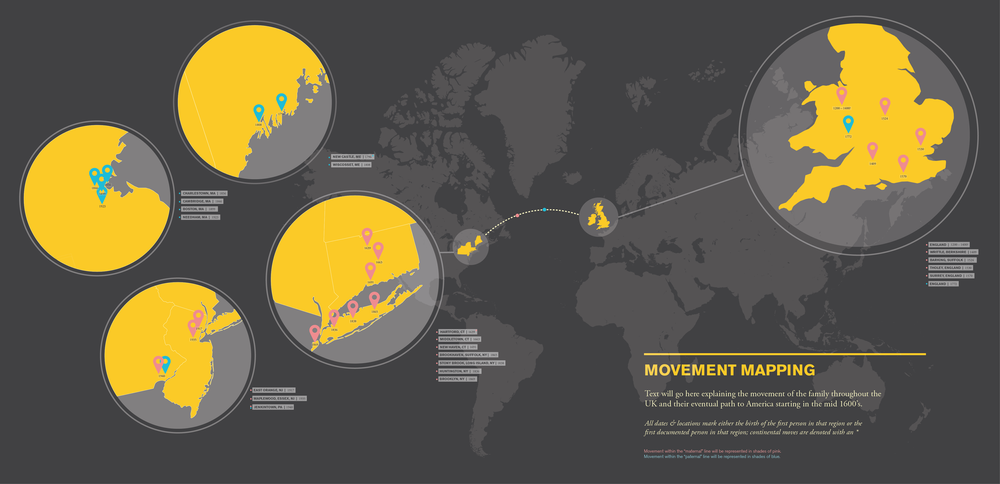
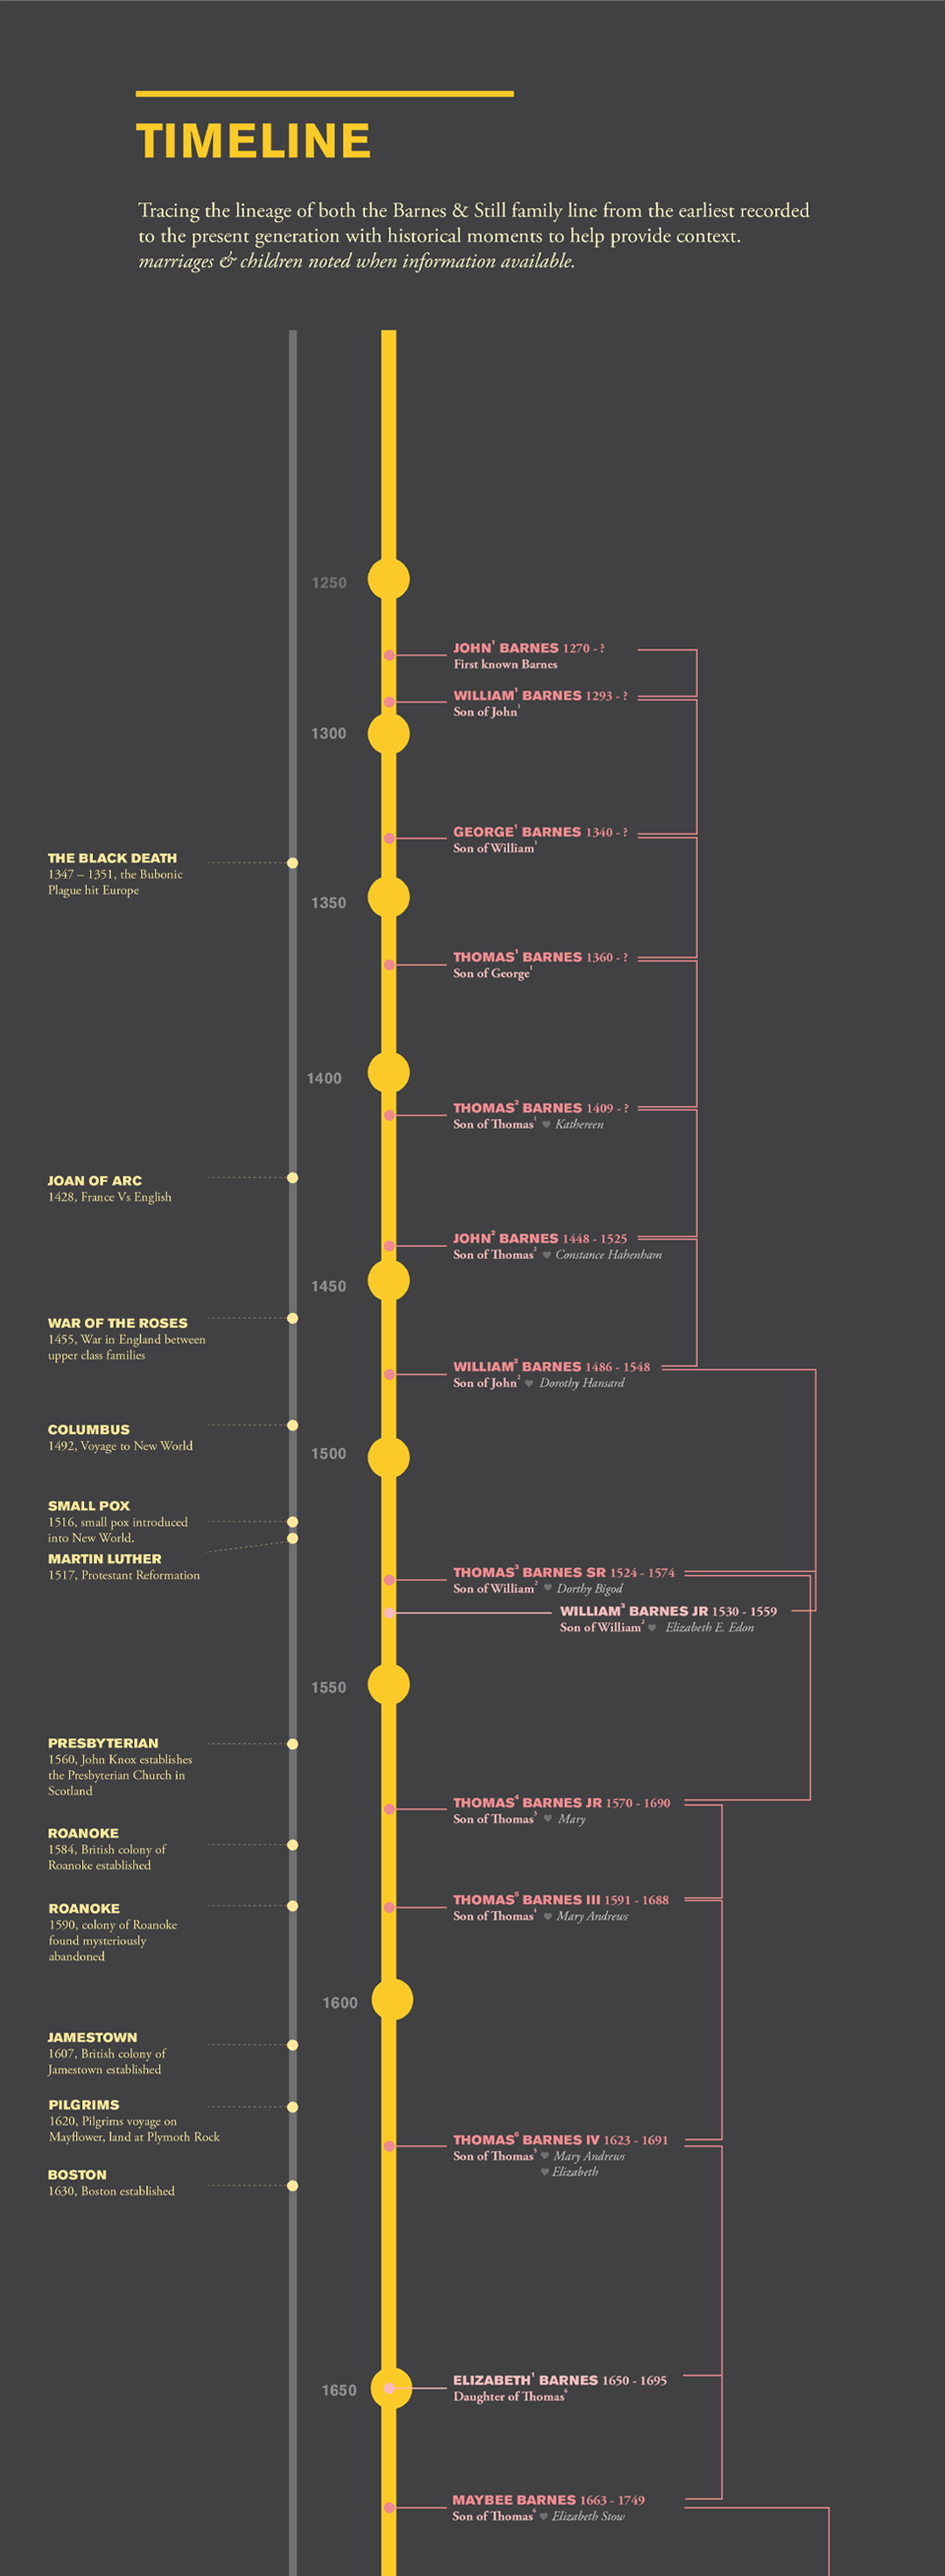
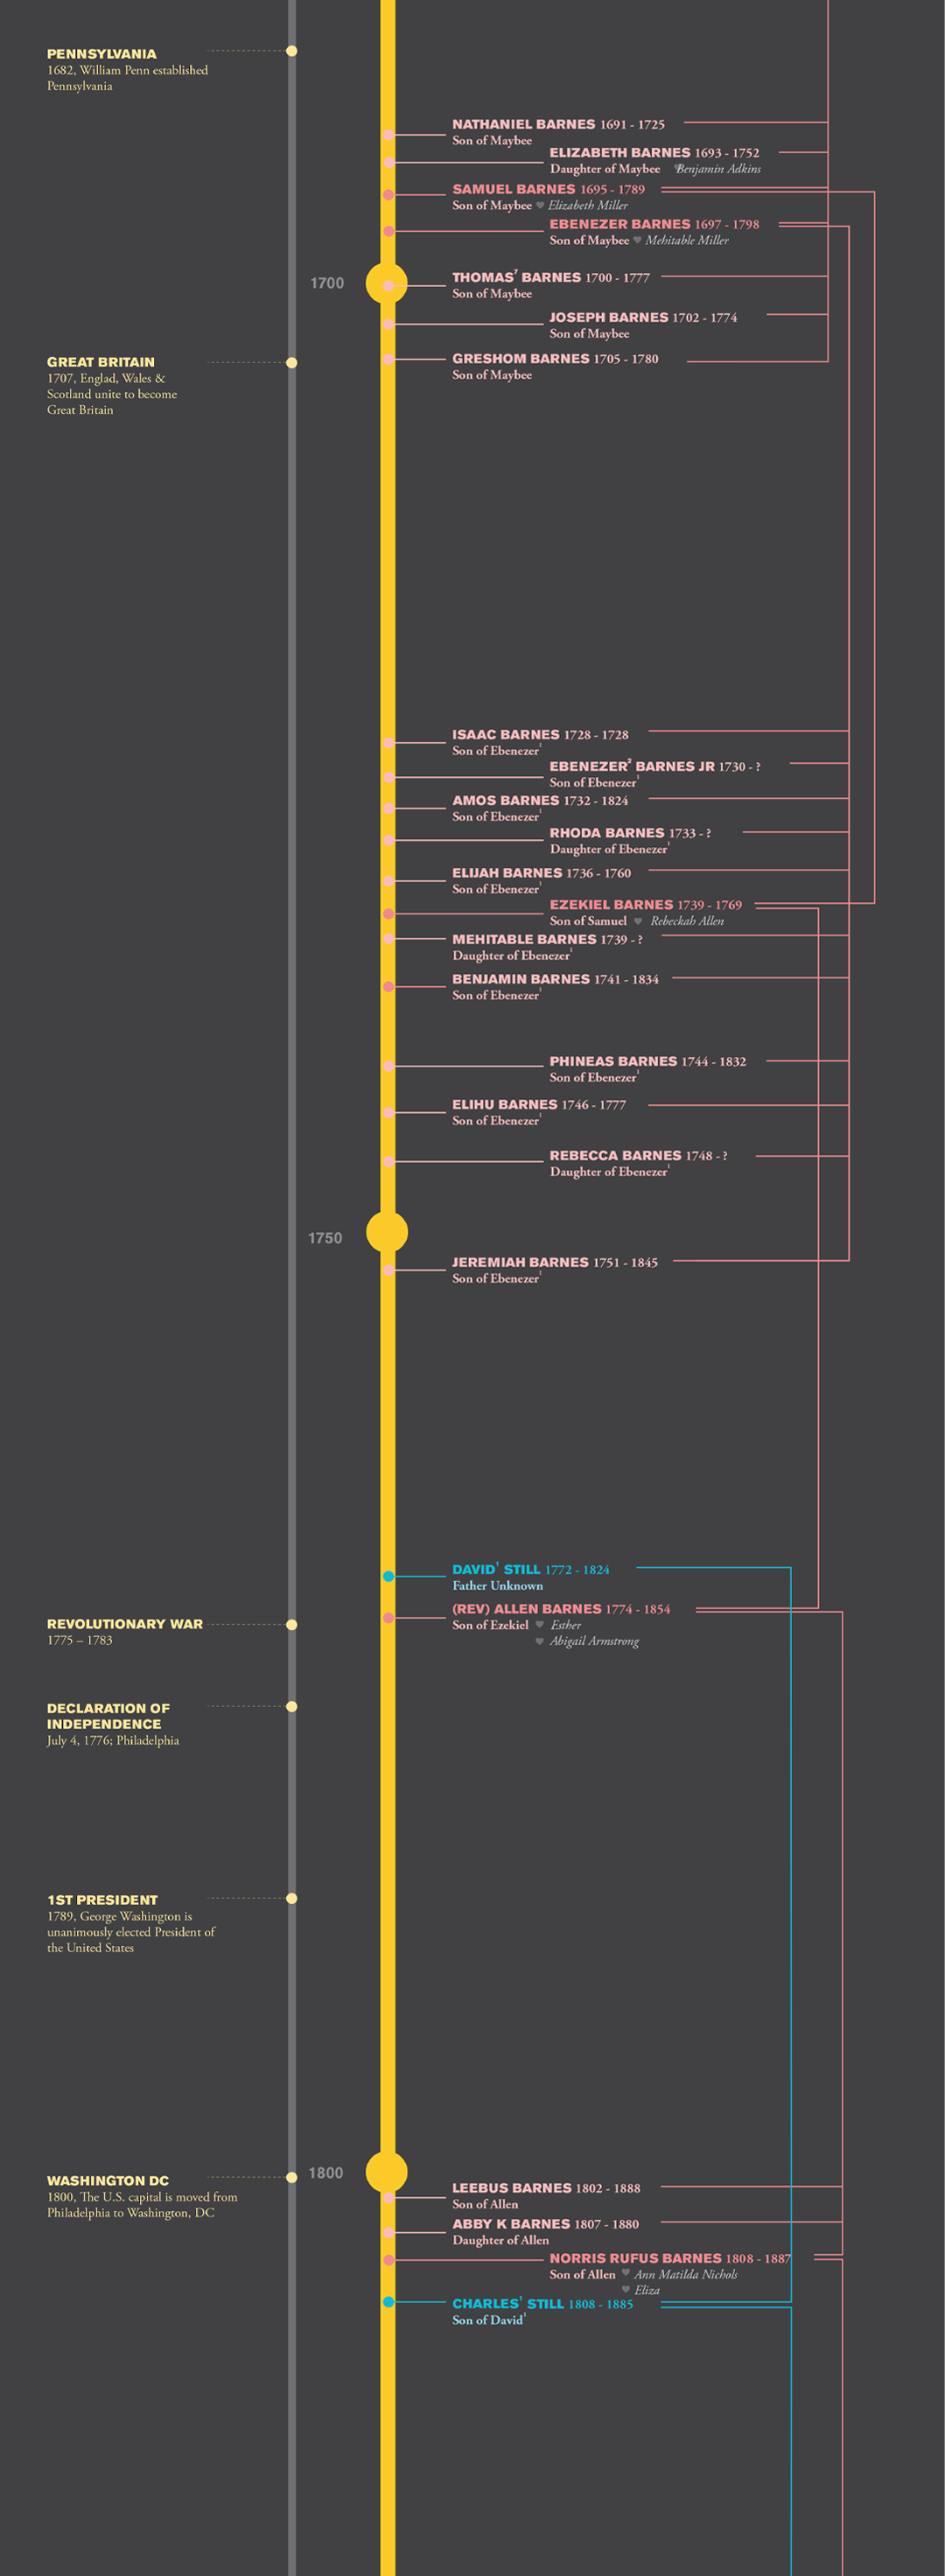
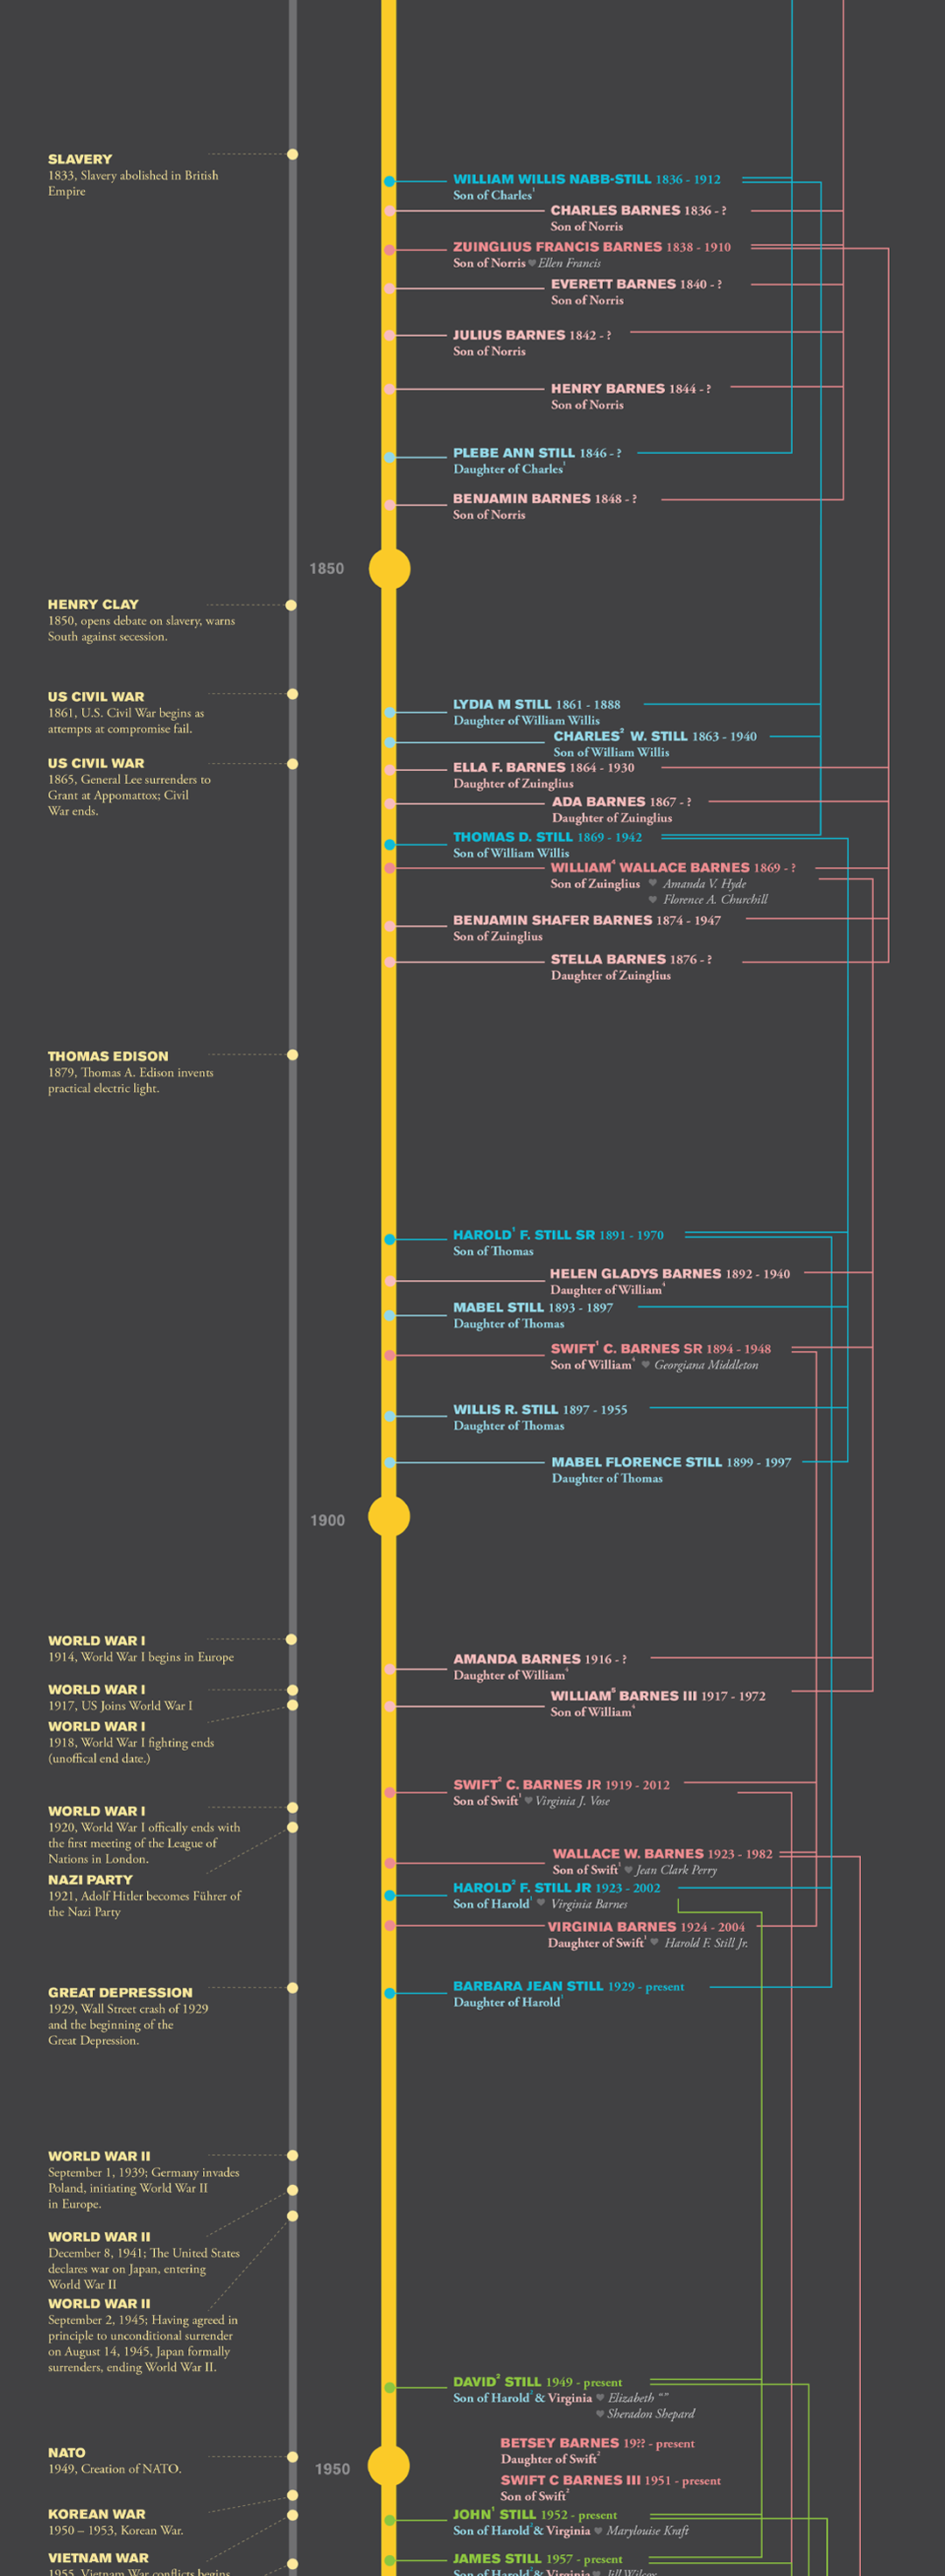
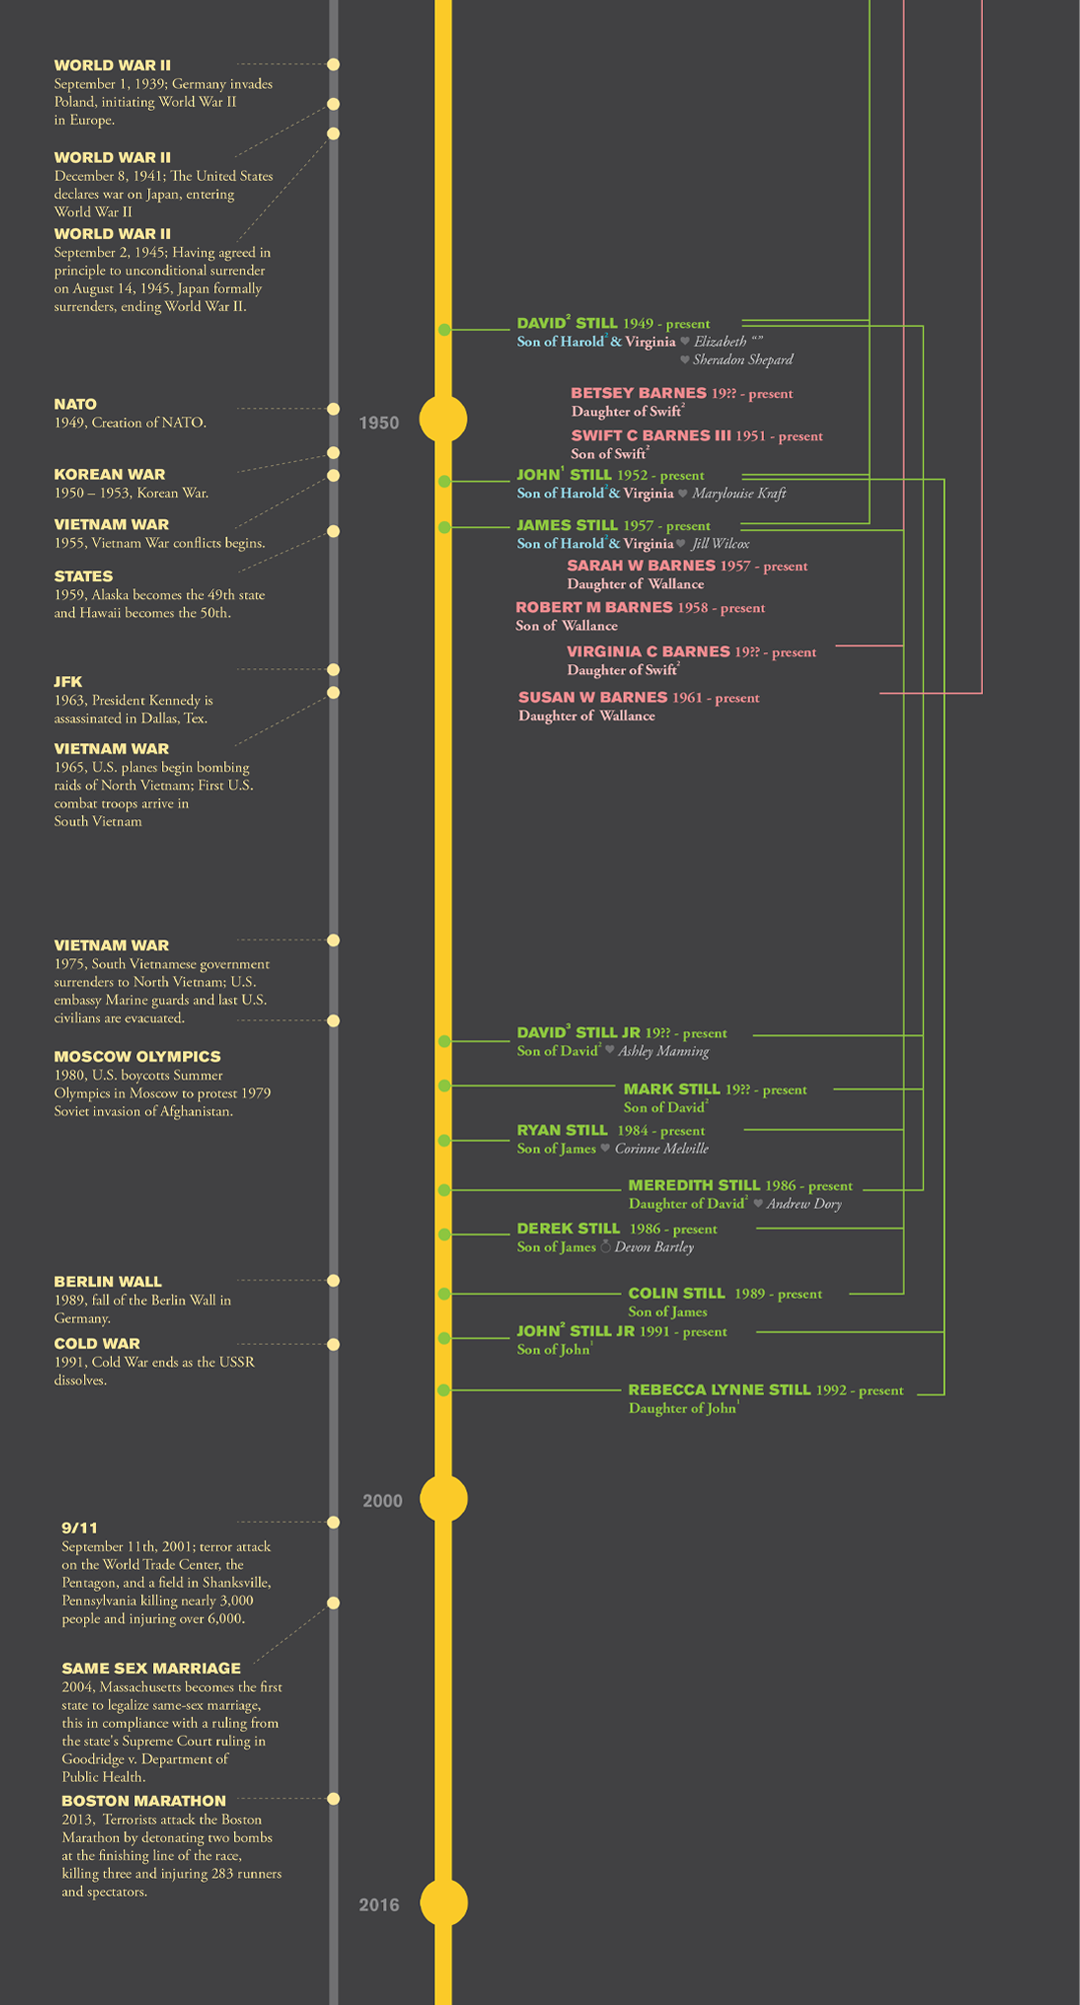
For my senior capstone project at Northeastern, I utilized genealogy data gathered by my father and great uncle to trace my father's paternal and maternal lines from the present back to the 1200's. The project consisted of multiple components: a timeline that traces lineage parallel to historical context, a map showing movement over the centuries, a series of infographics based on patterns found within the information, personal bios of select people, and a collection of photographs dating from the earliest photograph found. It existed in two ways: as individual components that fold by a grid and fit into a hand-made portfolio and as two large prints for ease of viewing in a gallery setting. The hero component of the piece and the biggest piece by far, the timeline, is over 9 feet long when unfolded.
charity: water
201910 Million Served
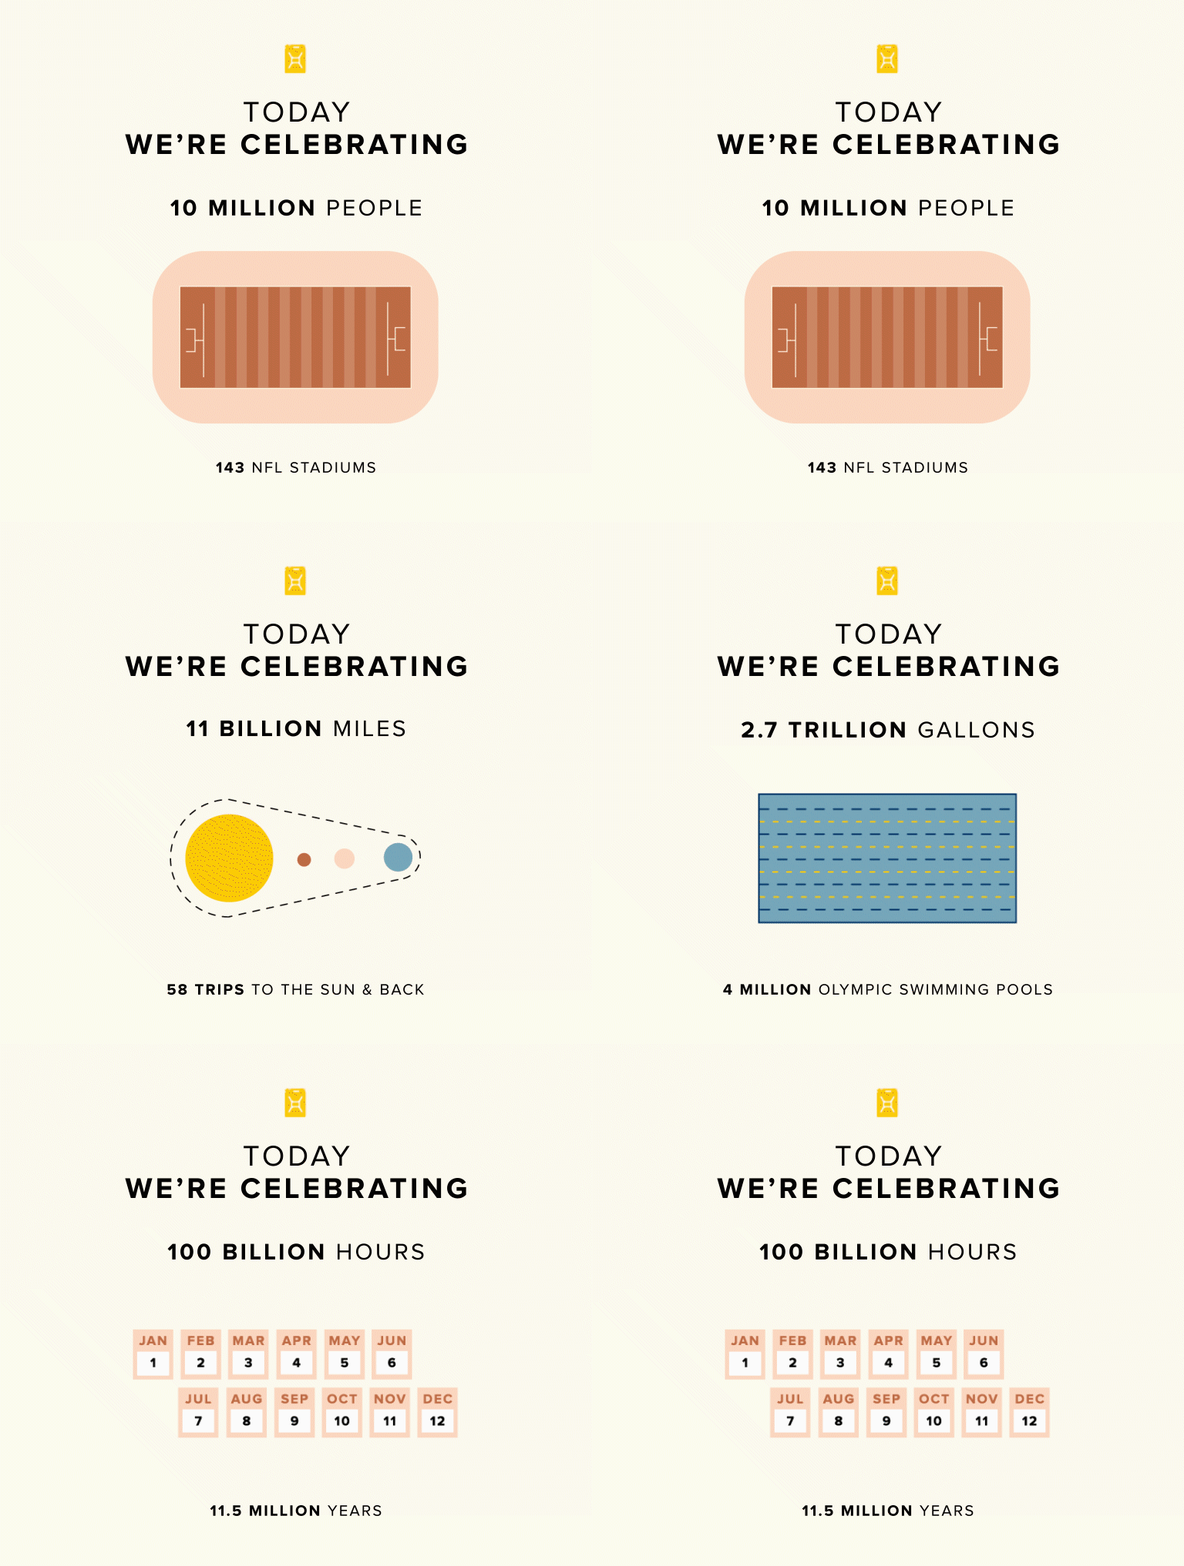
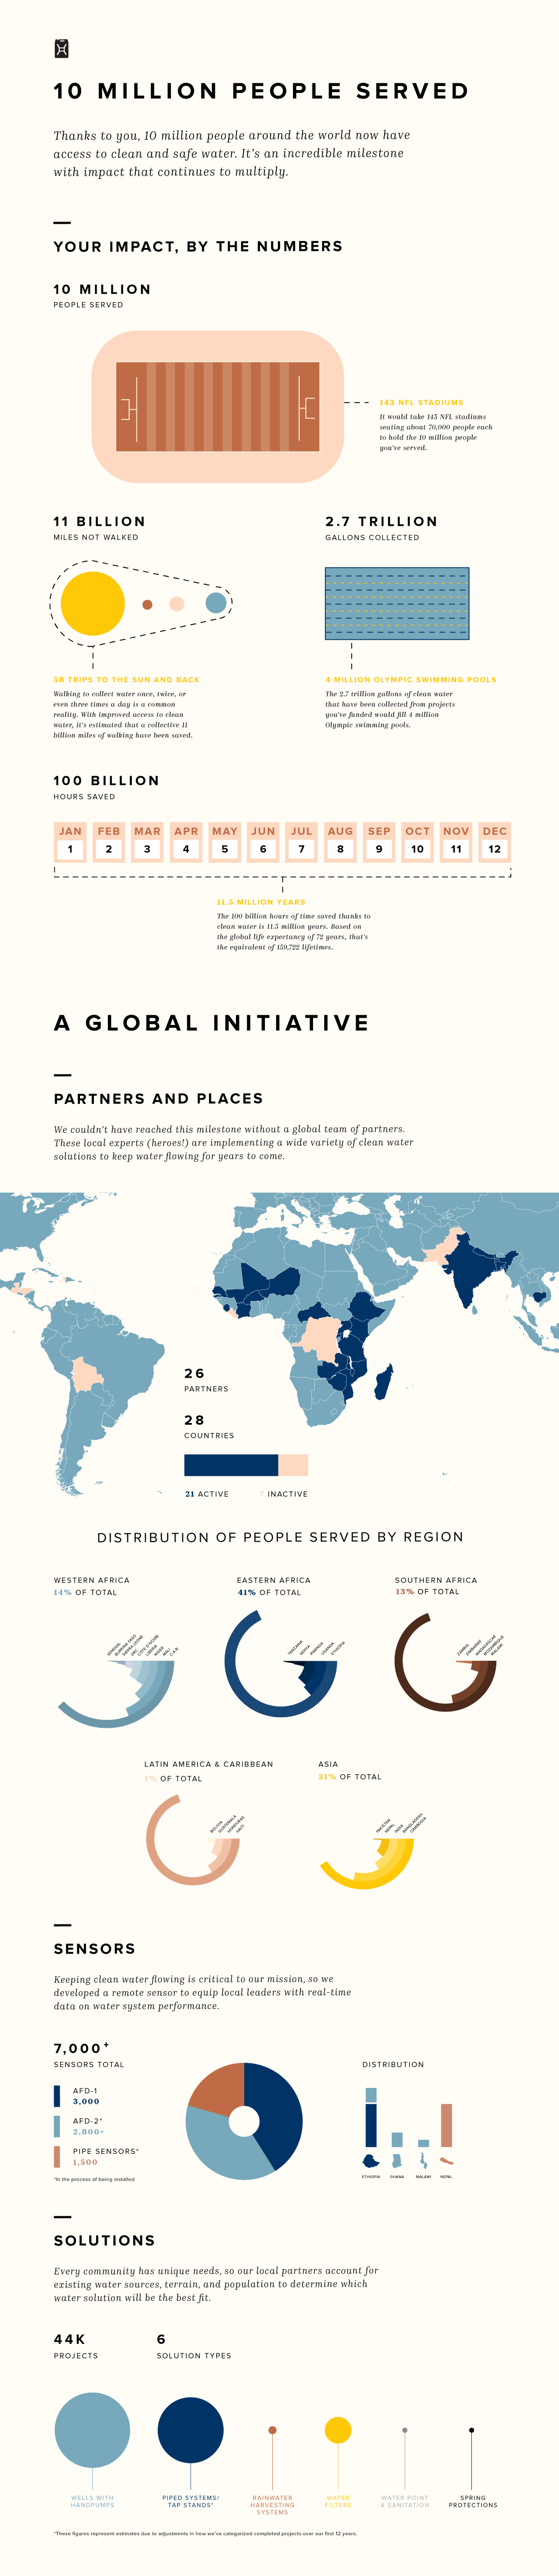
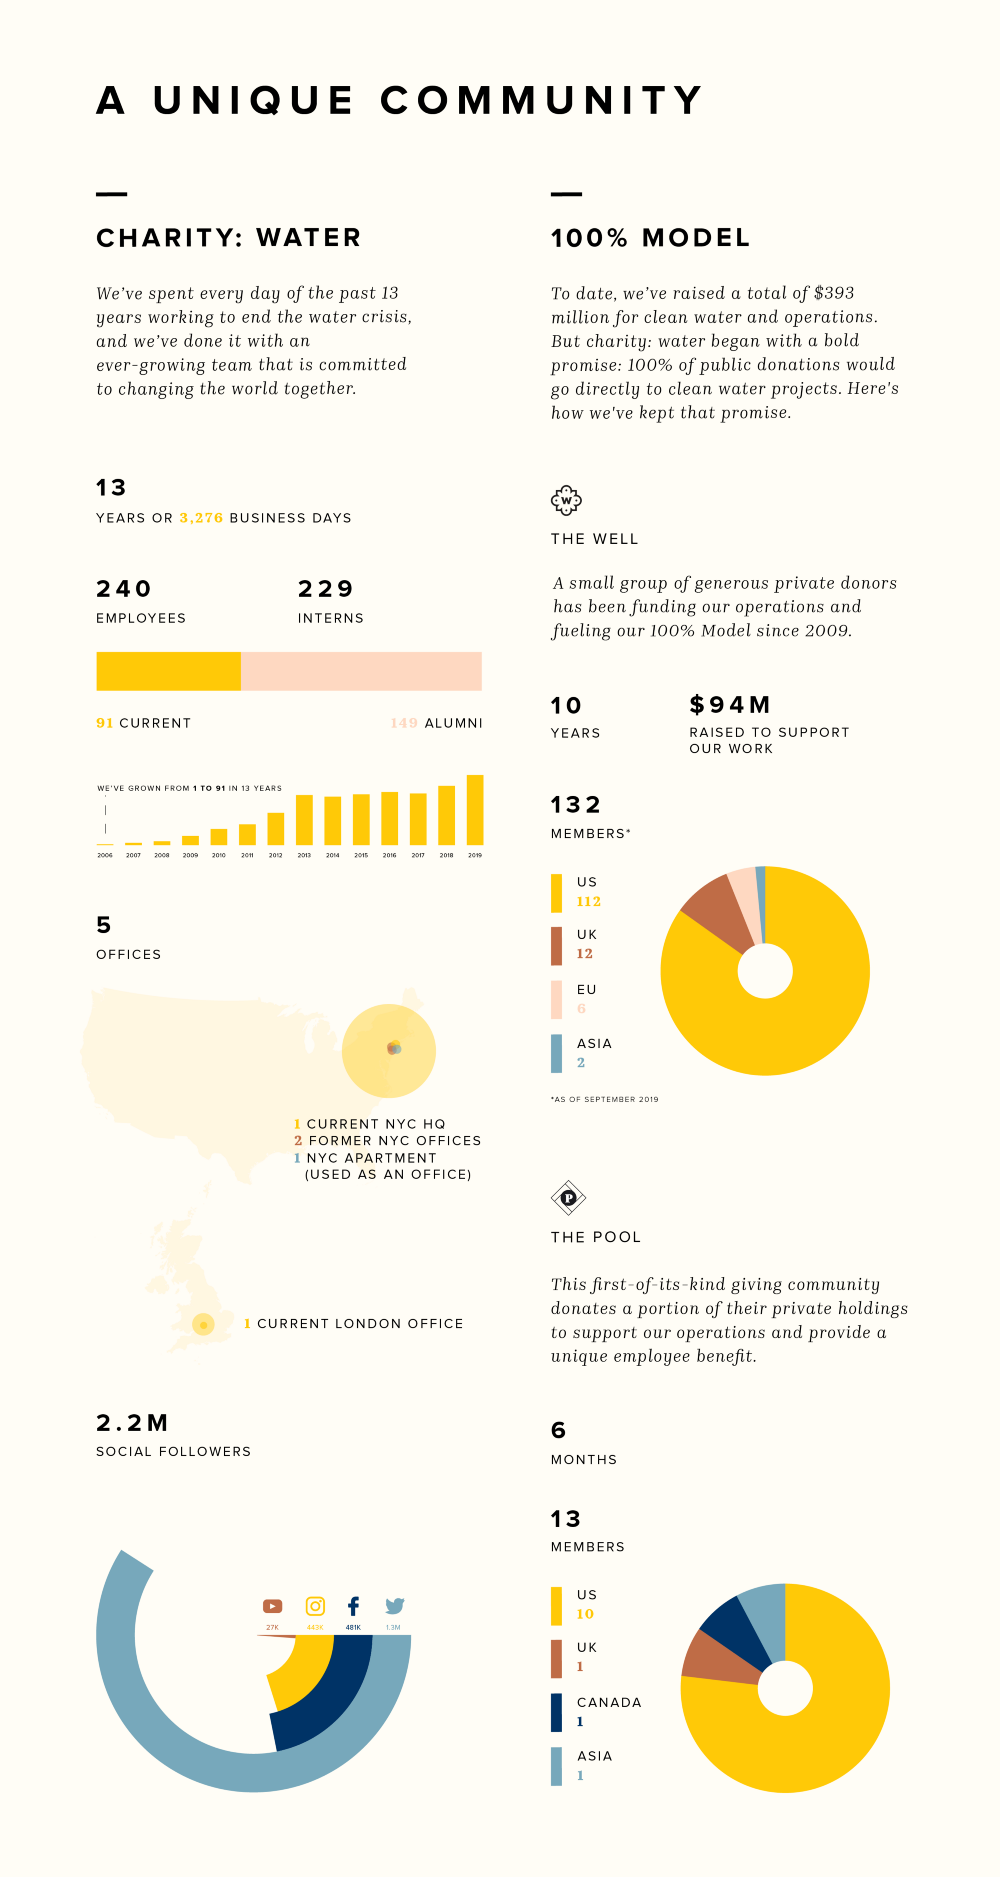
In 2019, charity: water, a non profit working to bring clean and safe drinking water to the 785 million people worldwide that lack access, hit a huge milestone: 10 million people had received clean drinking water as a result of their work.
To celebrate this huge milestone, the organization wanted to do a campaign announcing hitting 10 million served. Unlike most charity: water campaigns, which focused on specific countries or communities, this campaign was uniquely all encompassing. As a result, the challenge was how do we create a campaign that represents everything 10 million means and everyone who helped us get there?
The campaign included emails, social media, shareable assets, a printed issue of charity: water’s newspaper The Drop, and an infographic-centric blog post (found here).
Read coverage of the campaign by Forbes here.
L’ATTITUDE
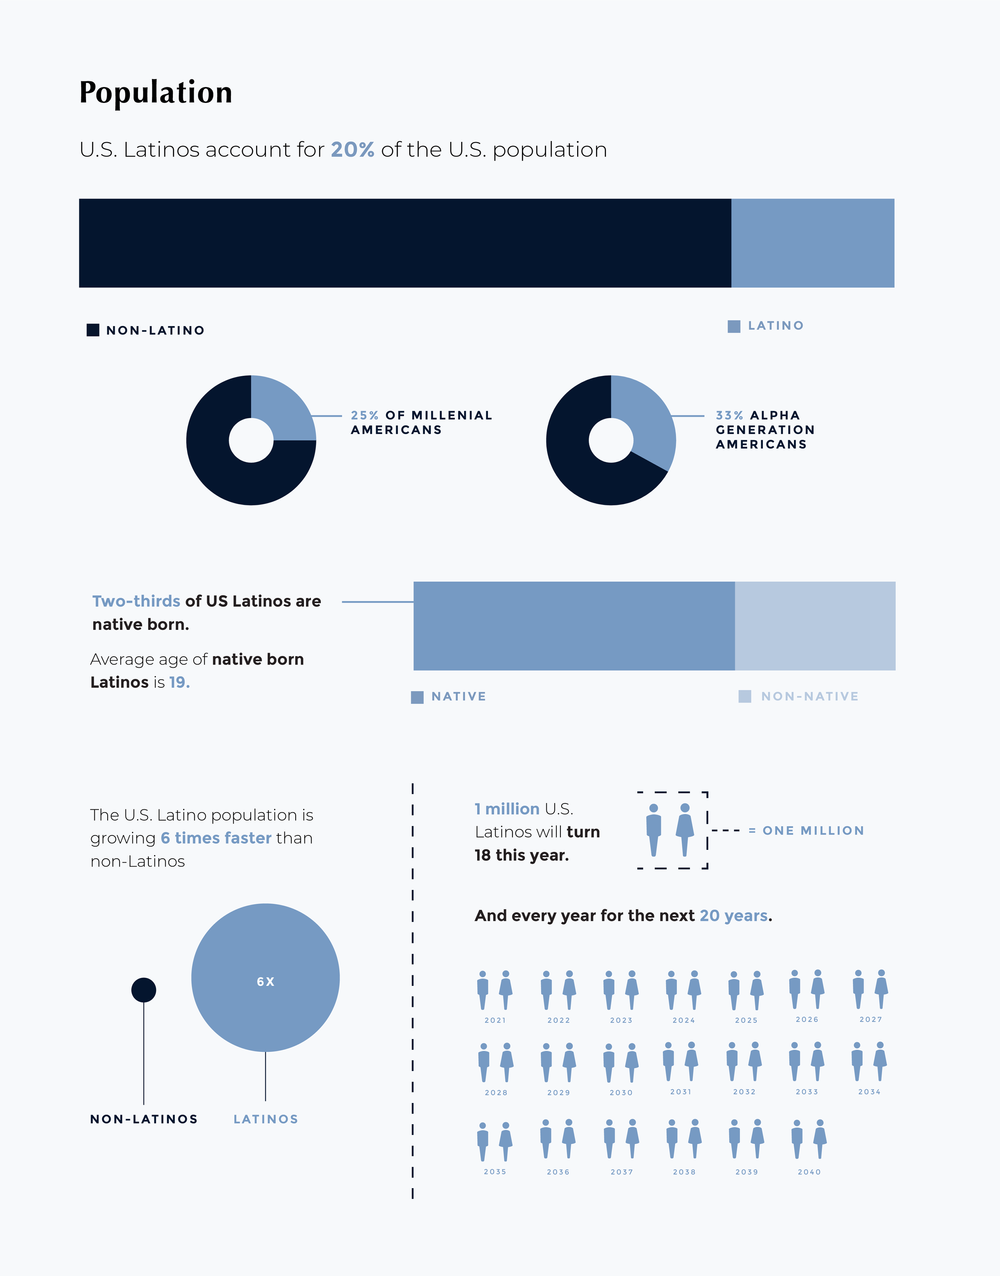
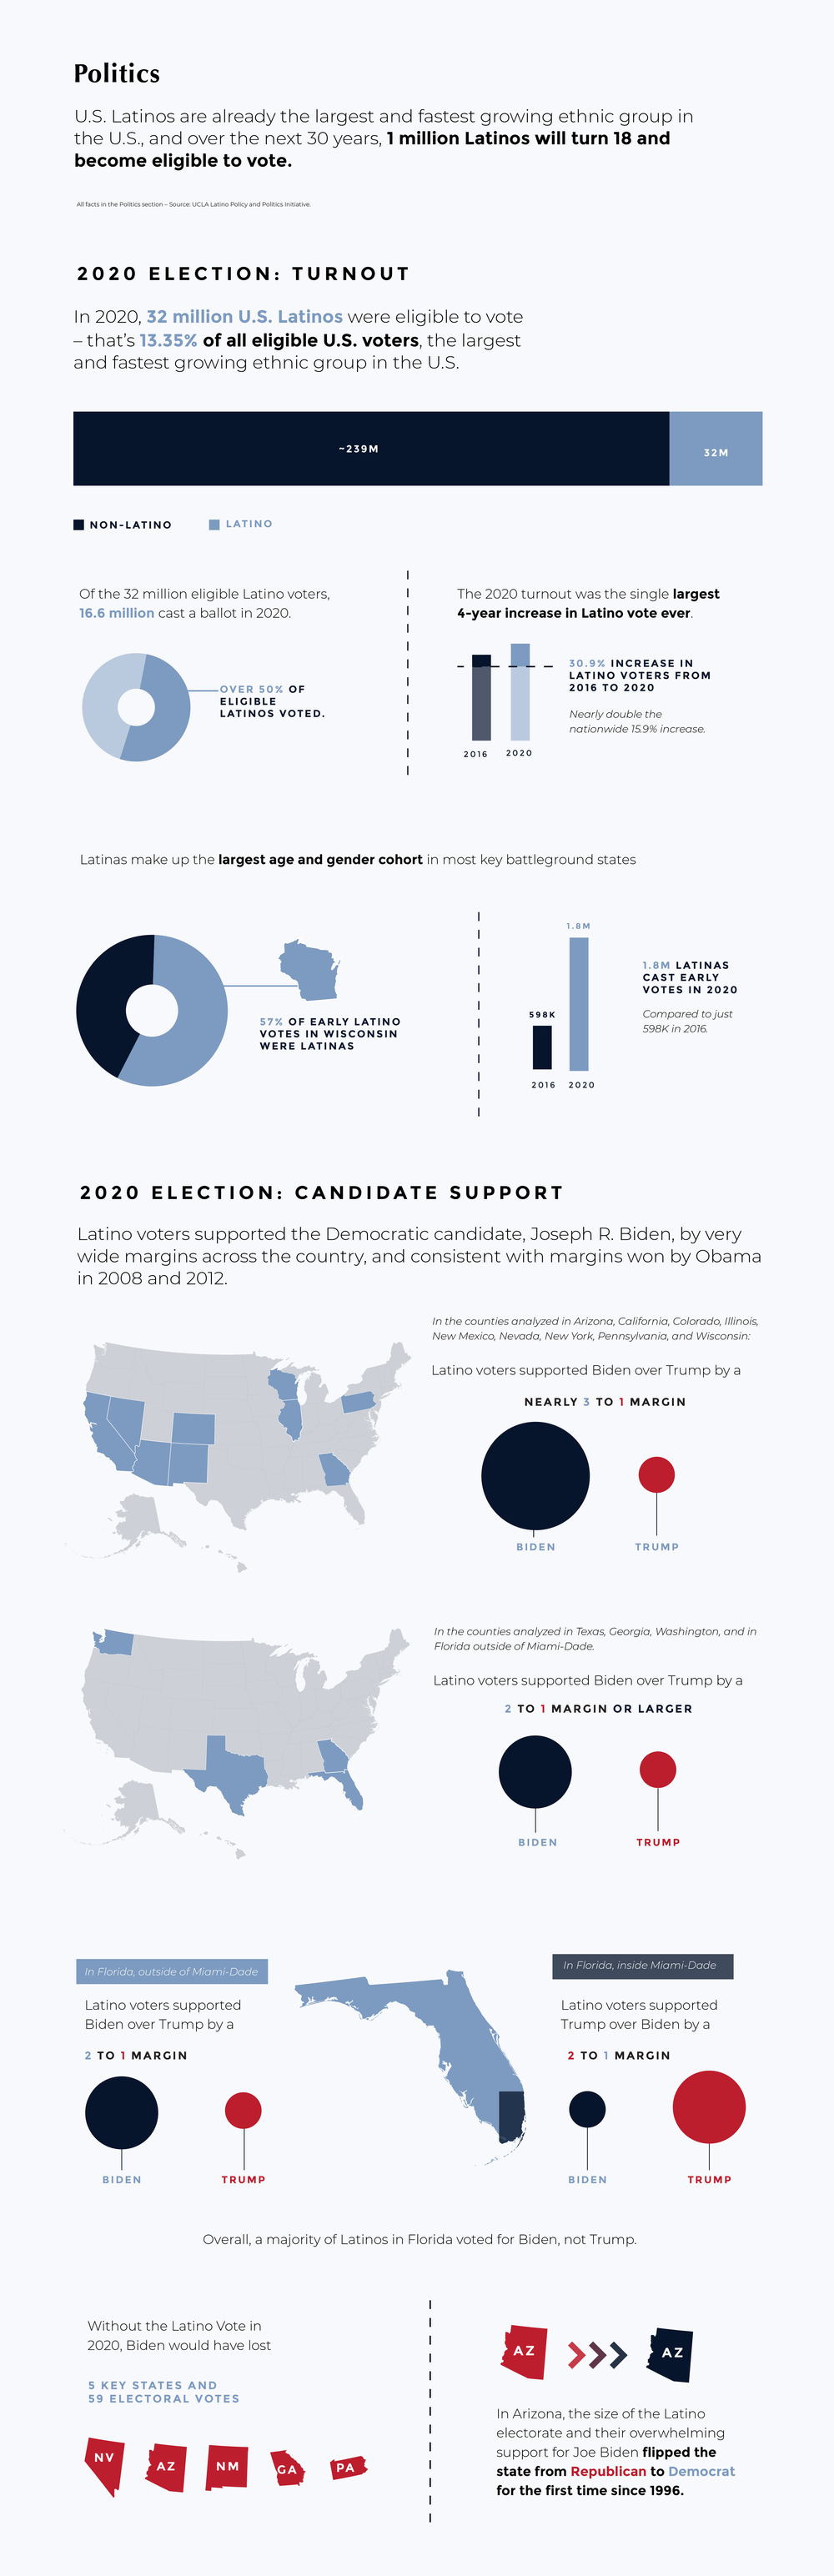
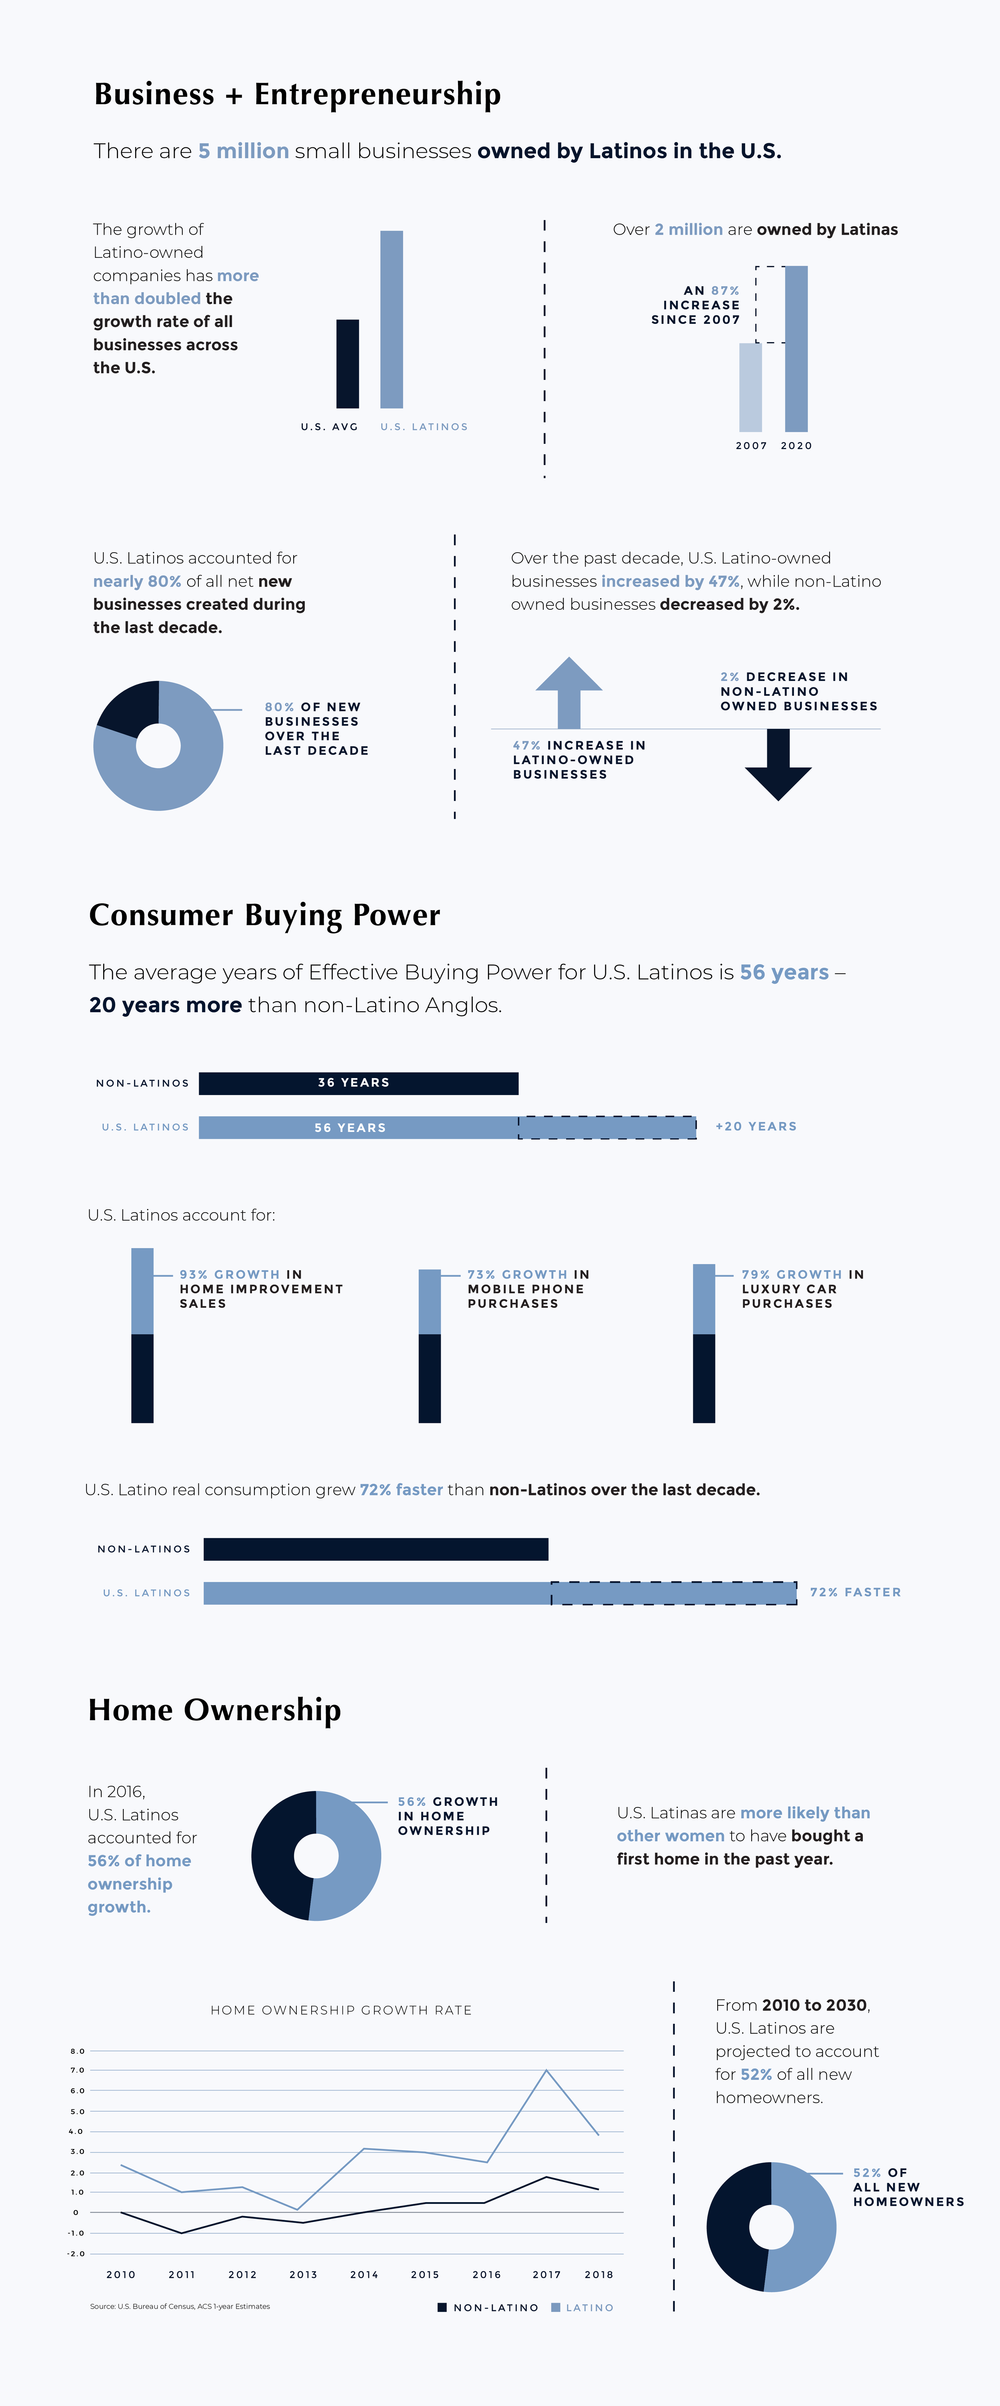
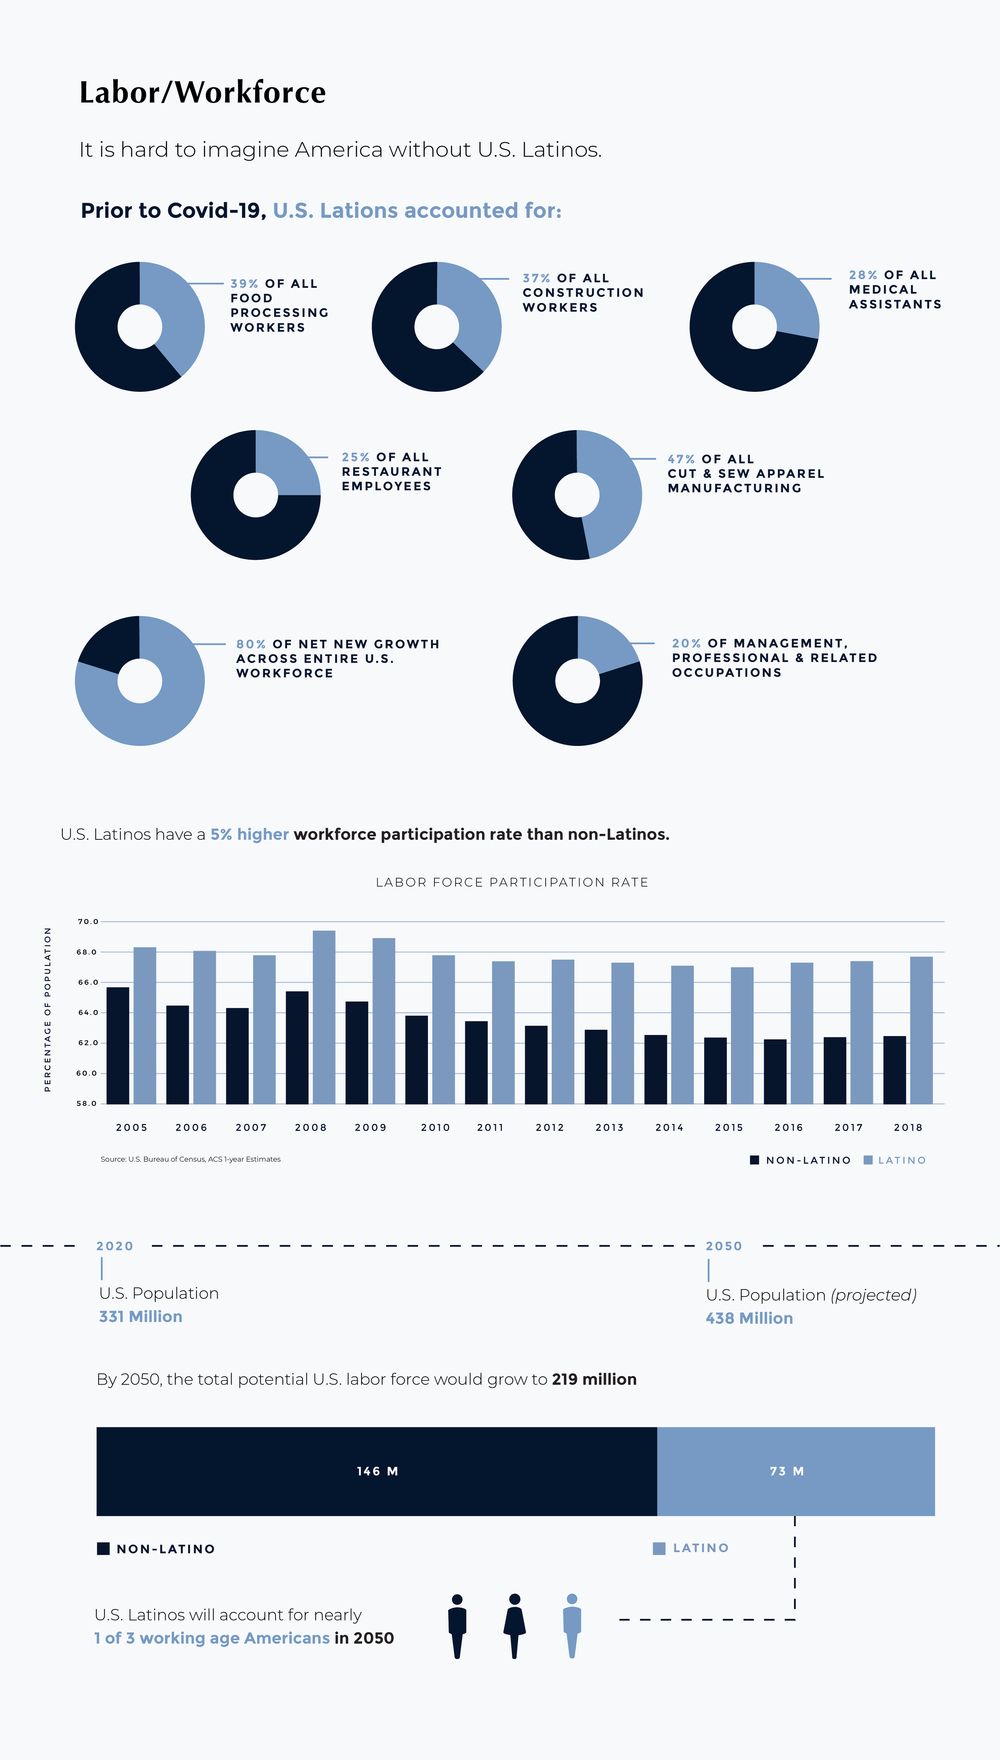
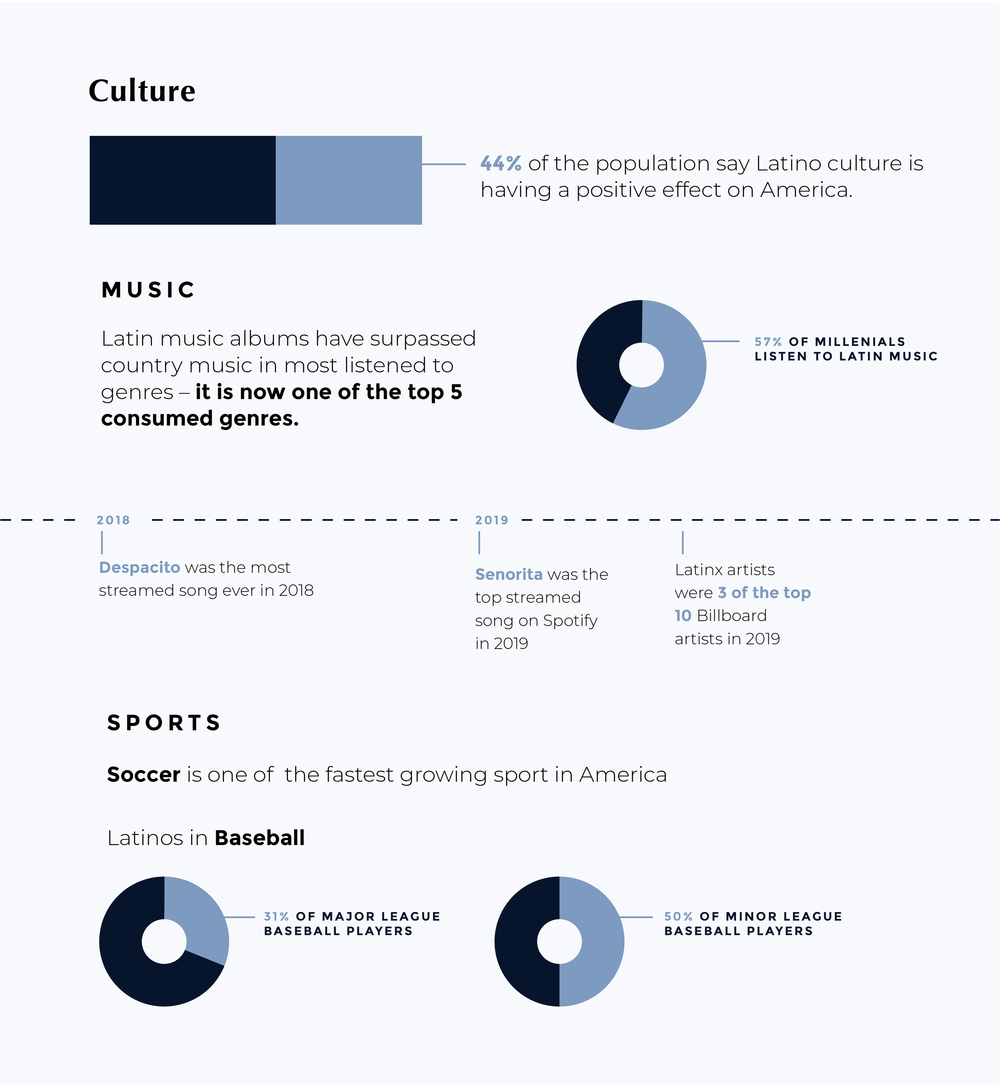
2020–2021Latino Impact by the Numbers
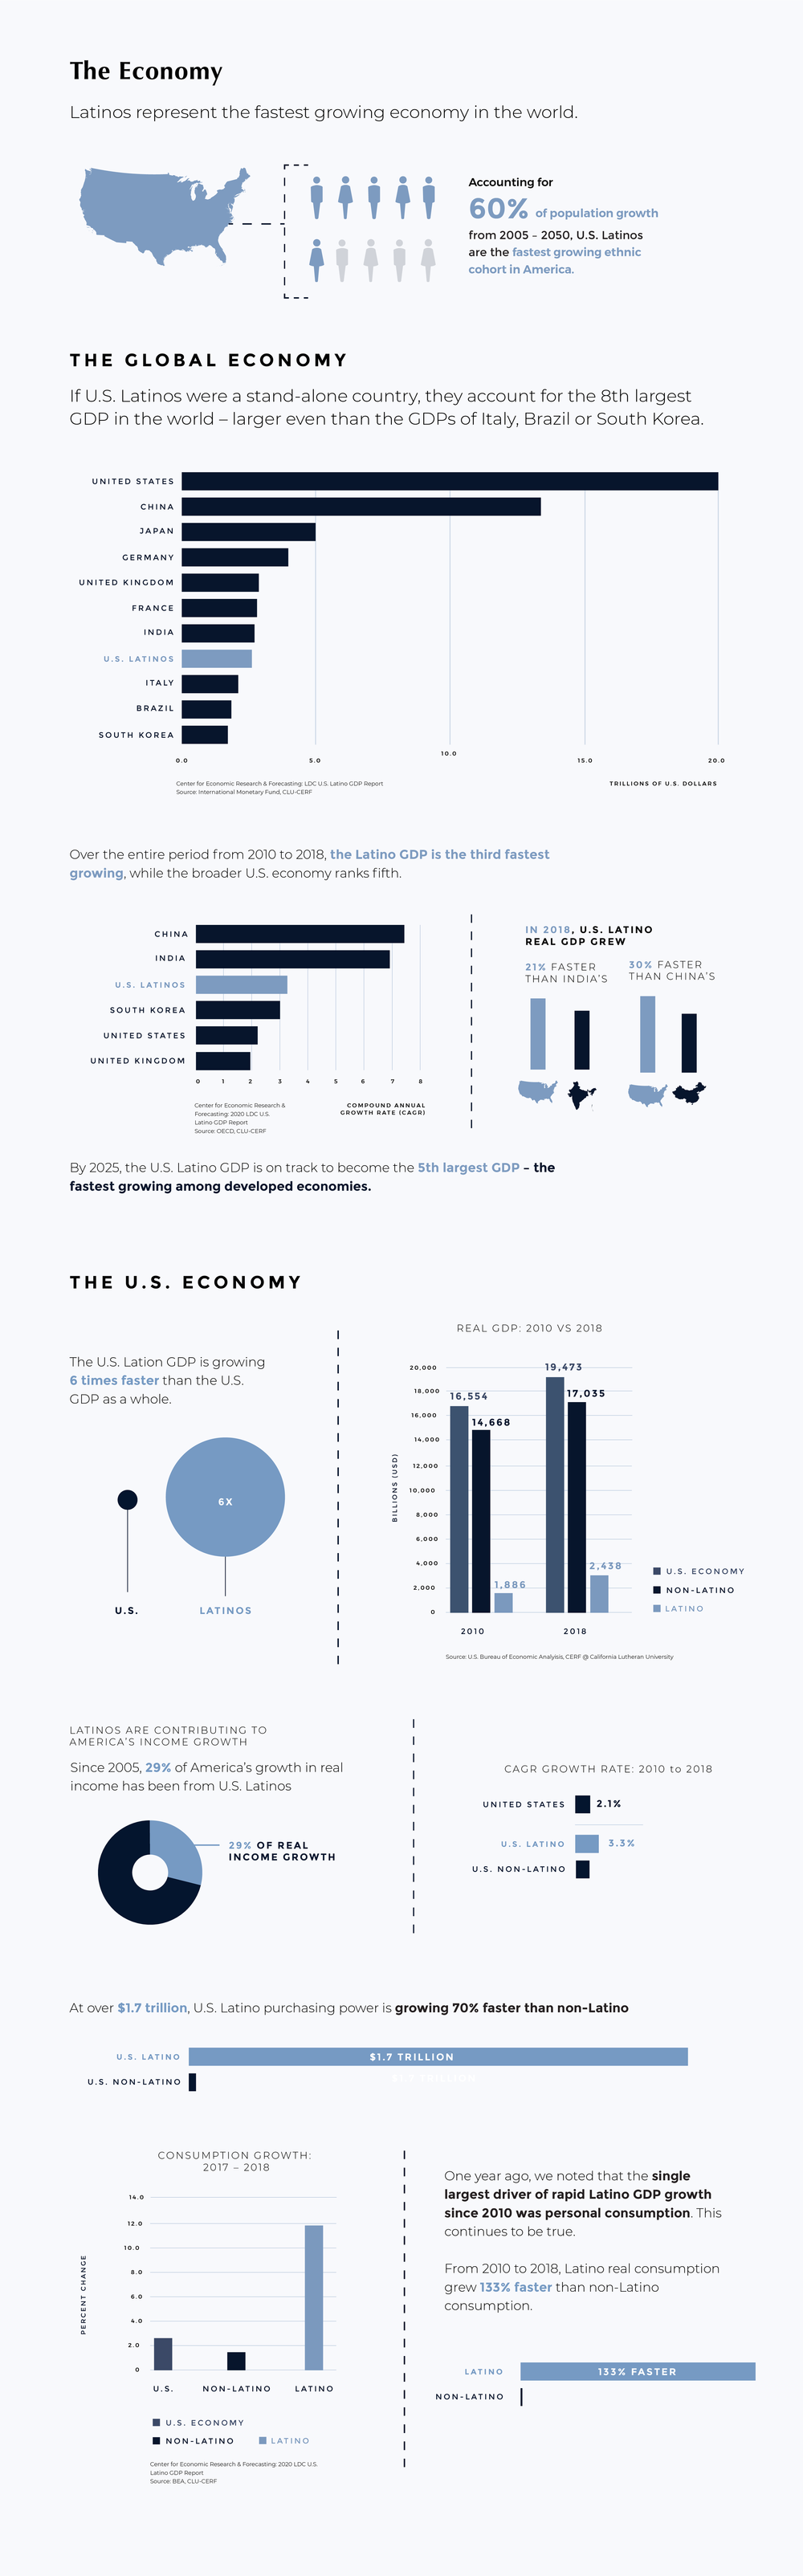
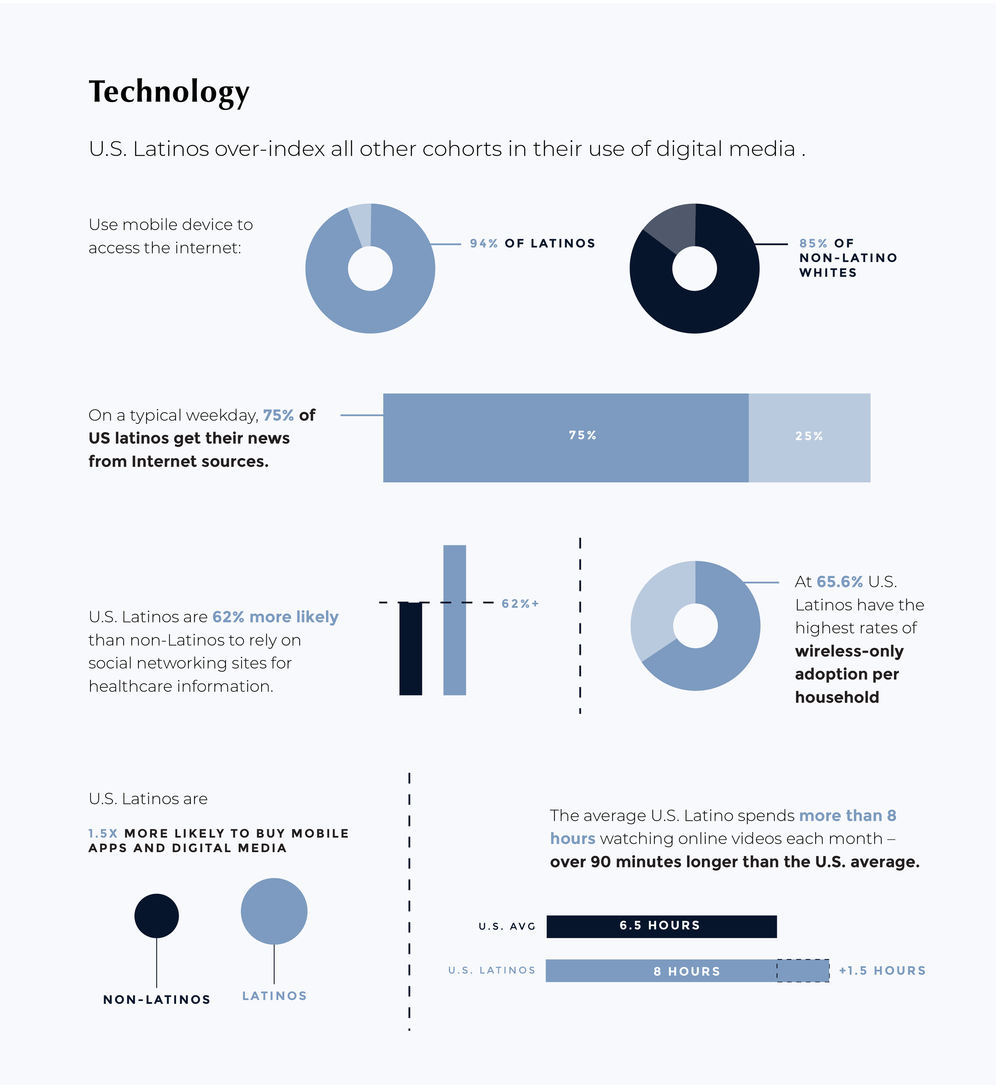
L’ATTITUDE was a recurring event that focused on the power of the Latino community–in business, entertainment, politics and more–in the U.S. They had an incredible amount of information about the impact of the Latino community, but needed a better way to present the data to the general public.
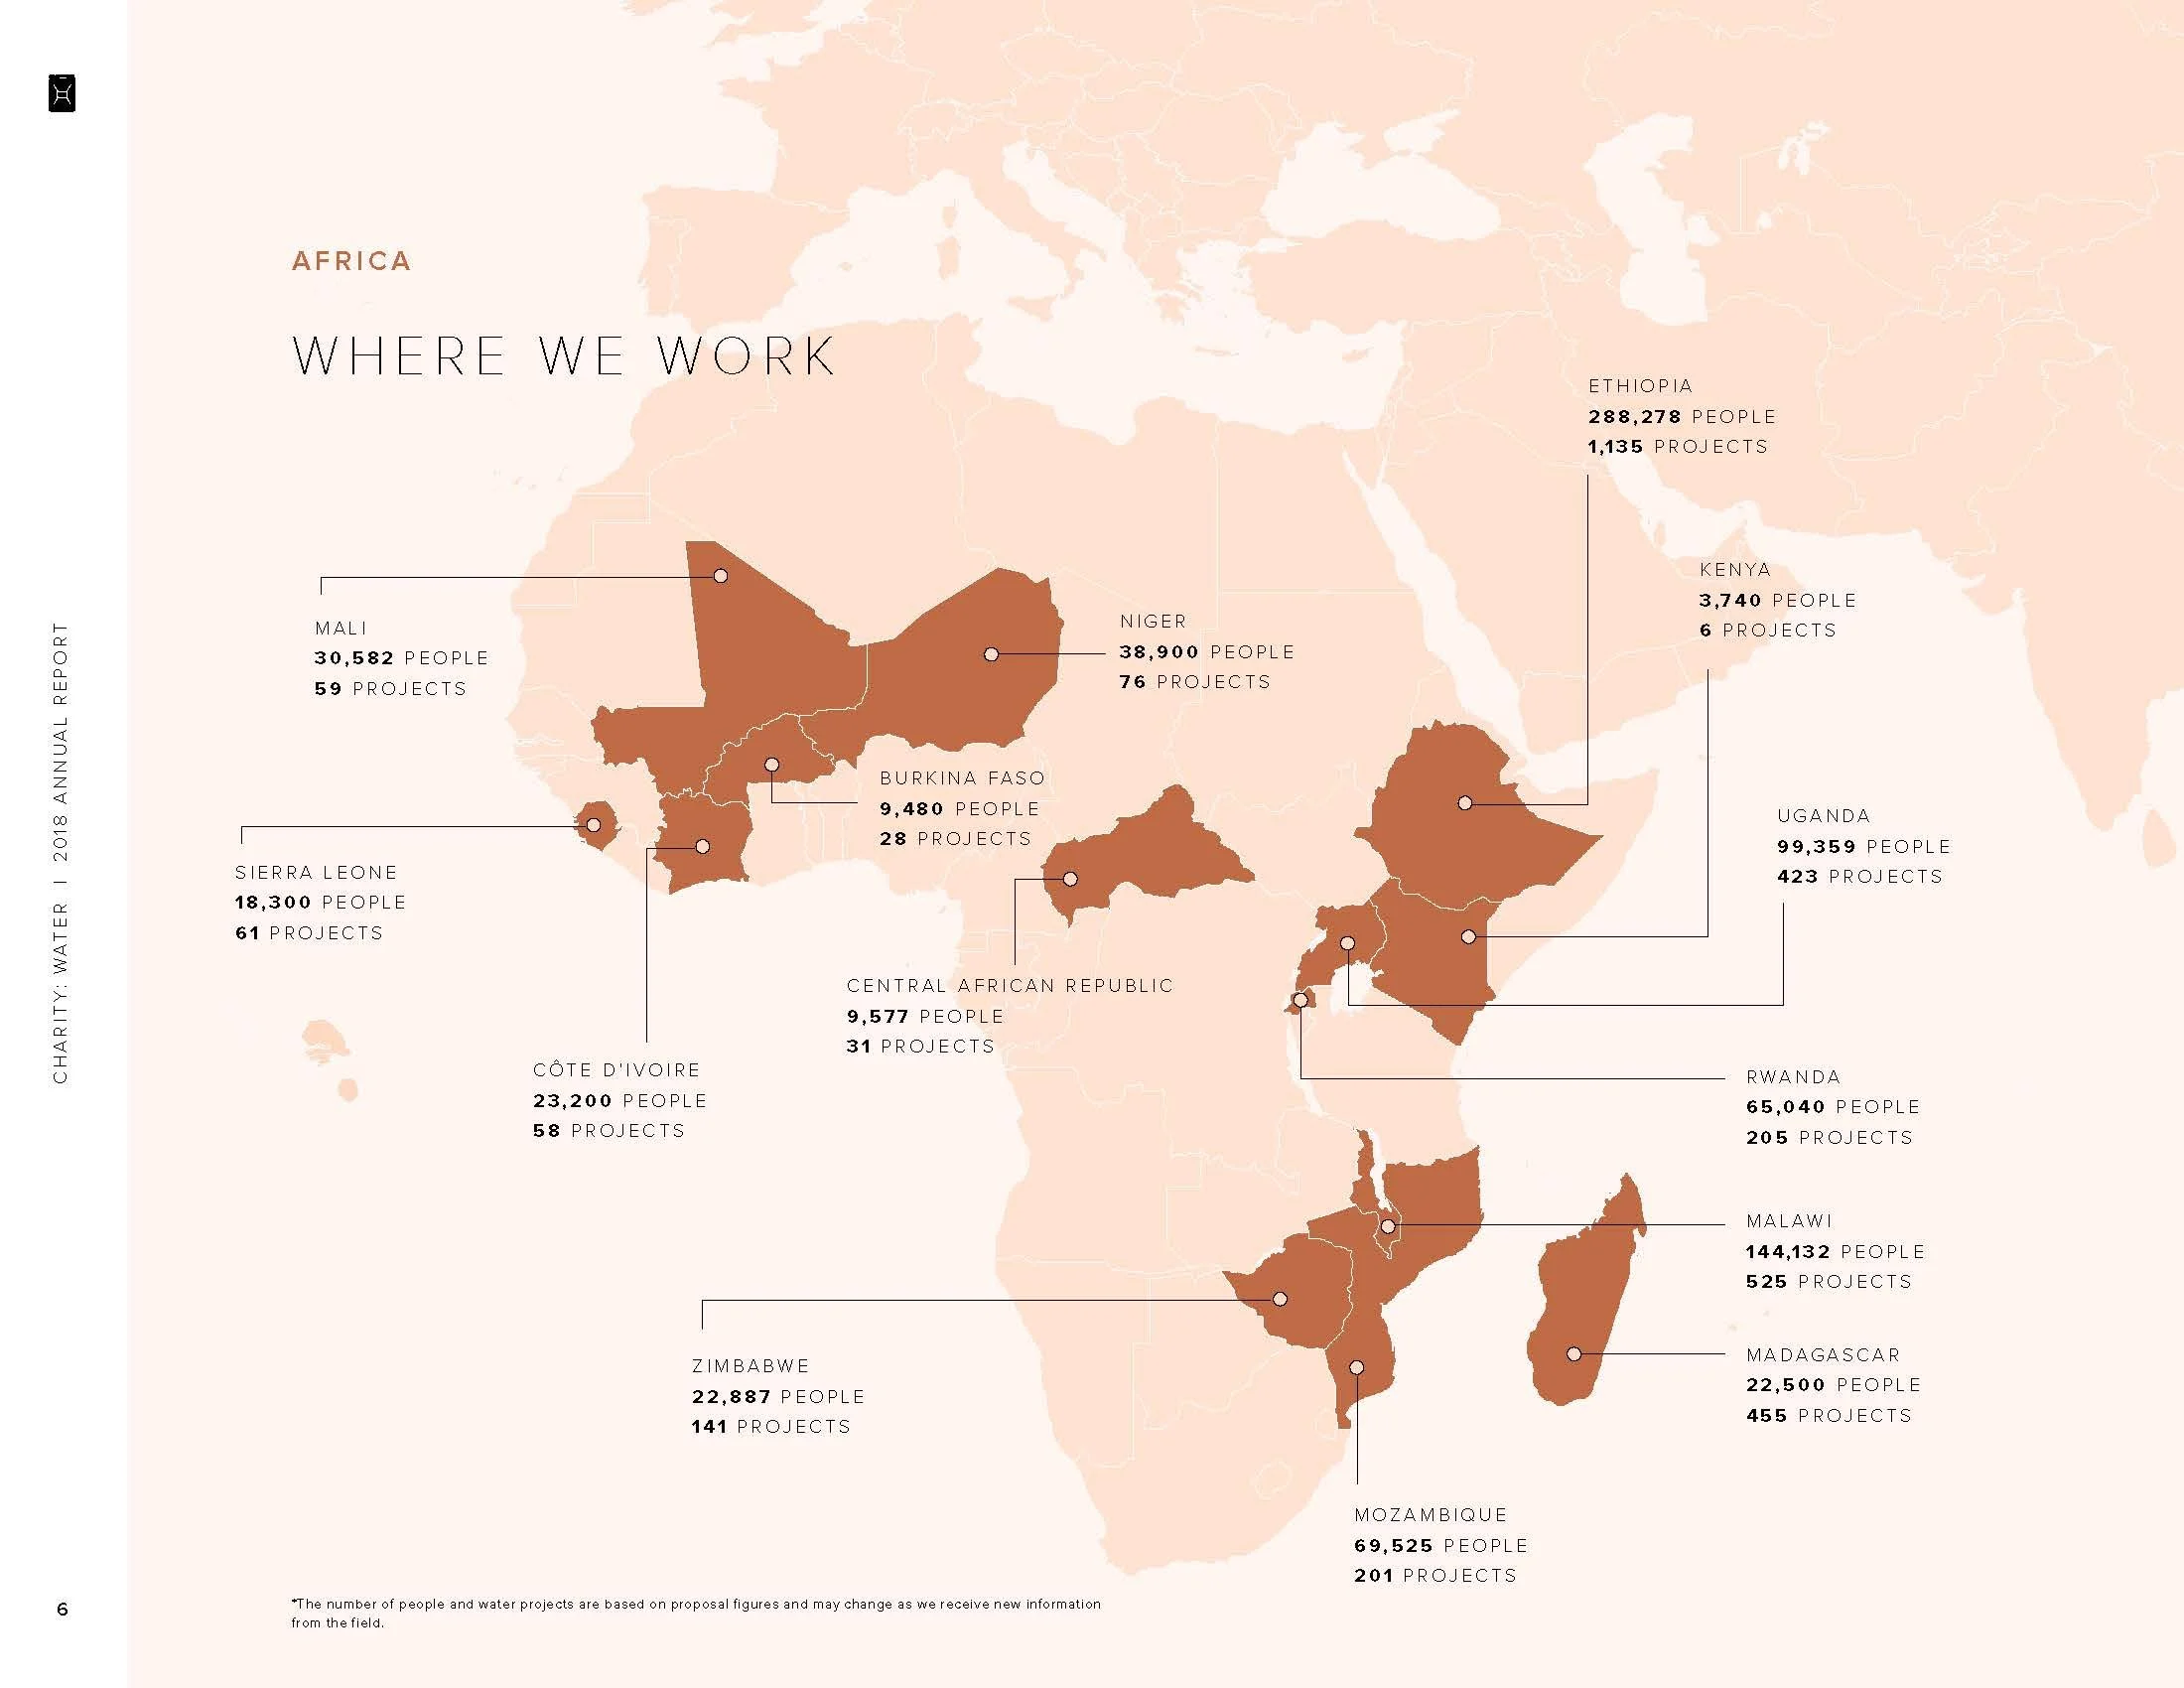
charity: water
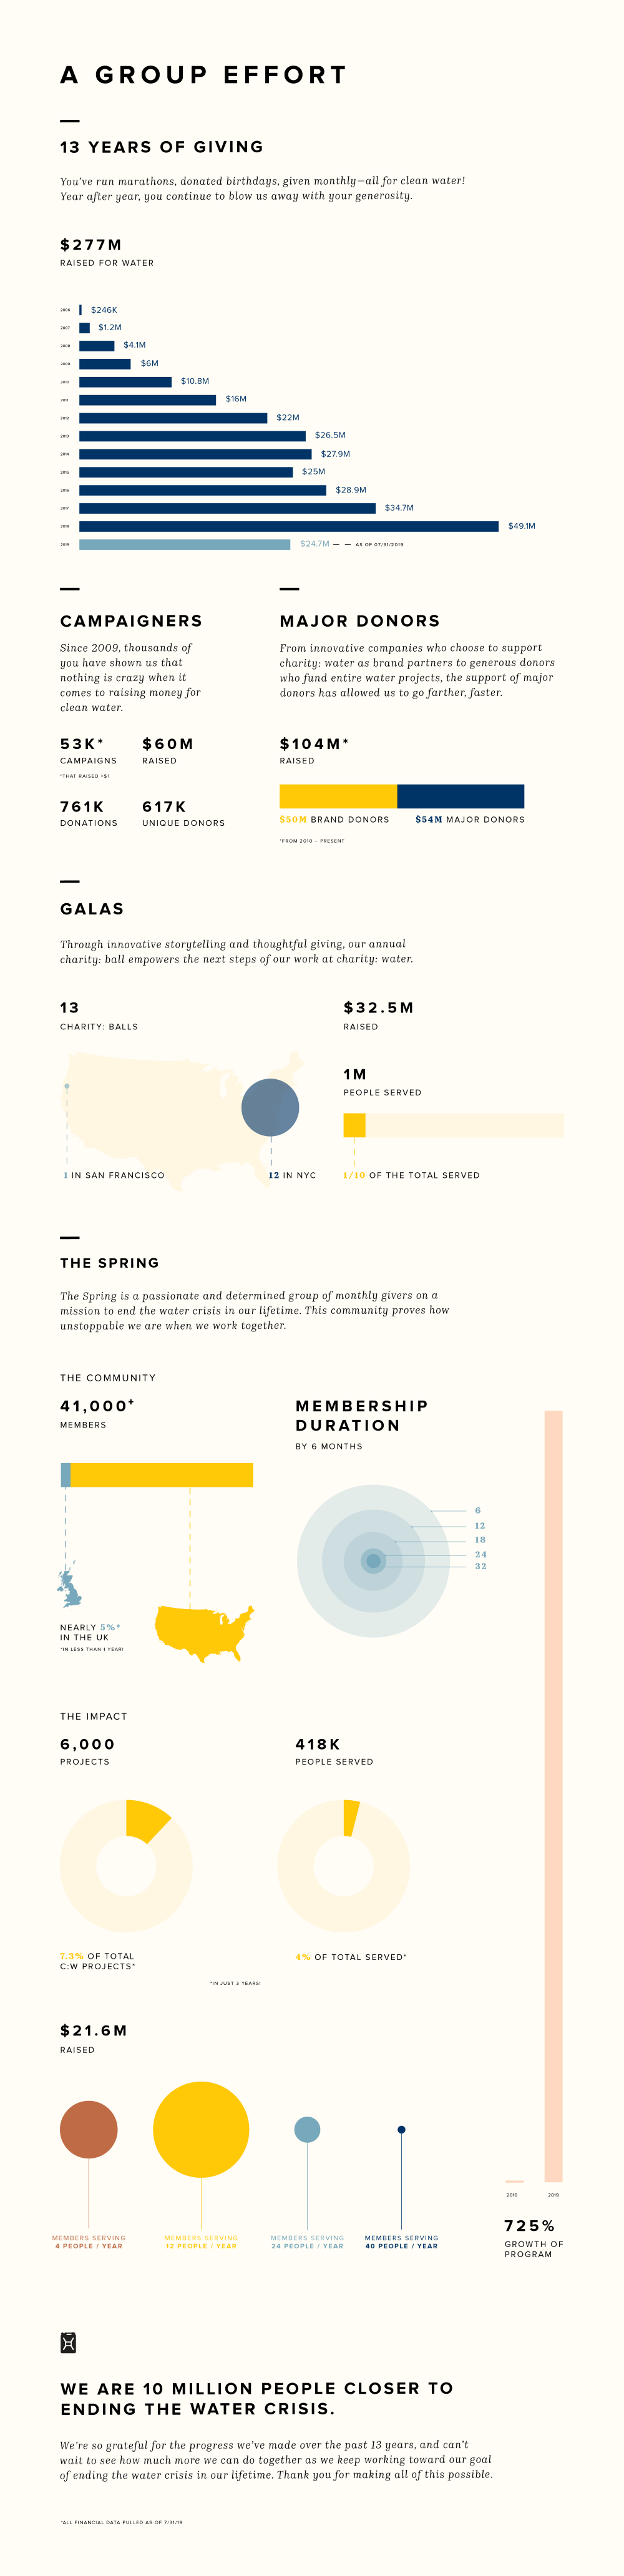
20182018 Annual Report
Explore More
-
![]()
Denver Preschool Program
Design Direction & Brand Refresh
Design Director | A Radish Lab Project
Website Design, Branding -
![]()
MenCare
Design Direction & Branding
Design Director | A Radish Lab Project
Website Design, Branding -
![]()
Nonprofit Association of Oregon
Design Direction & Branding
Design Director | A Radish Lab Project
Website Design, Branding -
![]()
California Certified Organic Farmers
Design Direction & Refreshed Branding
Design Director | A Radish Lab Project
Website Design, Branding -
![]()
Public Health Power Hour
Brand Design & Animation
Lead Designer
Branding, Animation, Social -
![]()
Rise + Vote
Campaign Design
Lead Designer
Campaign Design, Branding -
![]()
Marshall Plan for Moms
Campaign Design & New York Times/Washington Post Ads
Lead Designer
Campaign Design